What just happened to $WTC?
A 57% single‑day collapse leaves price stuck at the 0.010 area – a level that hasn’t mattered since listing. No futures positions remain, funding is zero, open interest is nil – this isn’t a liquidation cascade, it’s pure spot selling driven by conviction.
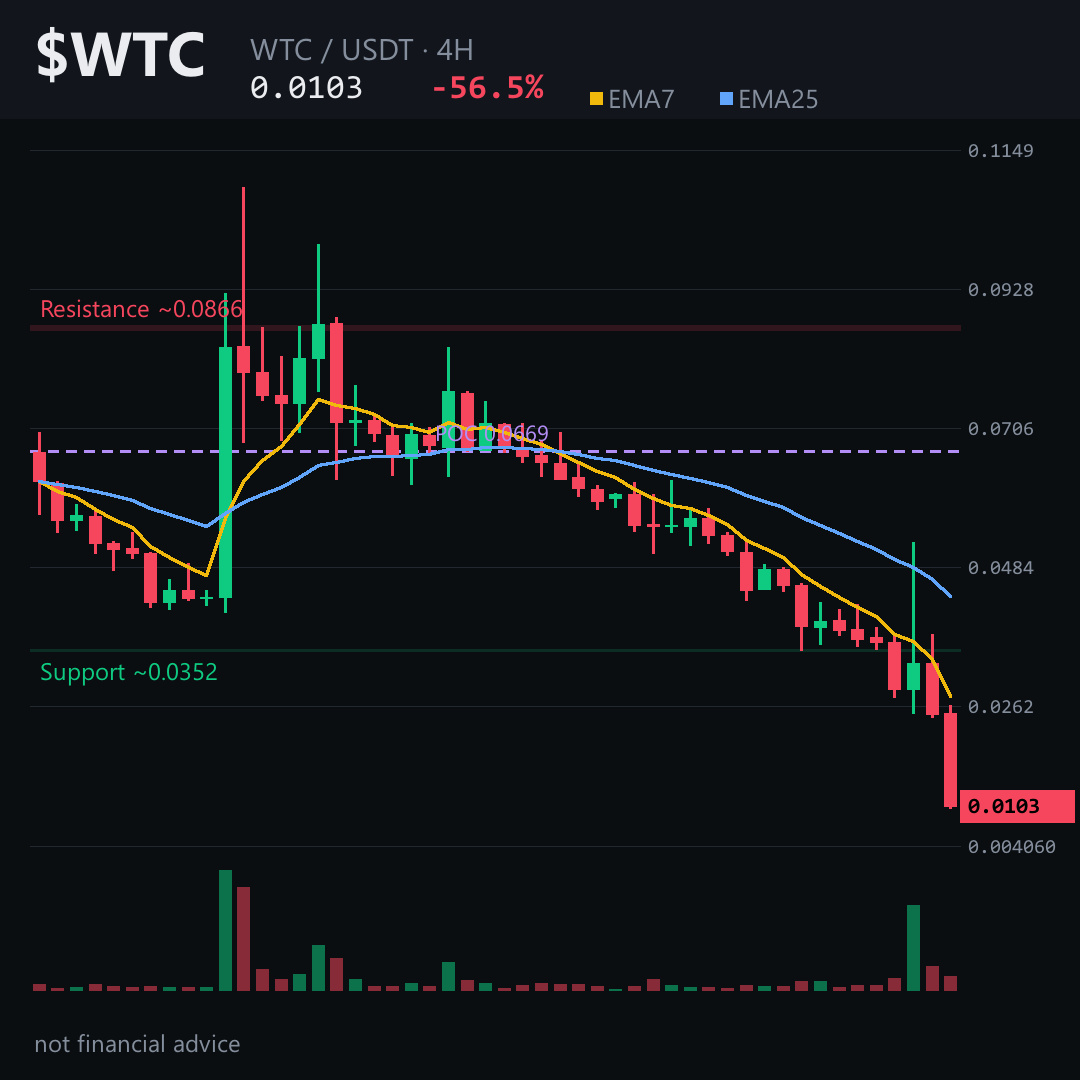
The 4H chart shows nine red candles out of twelve; the latest carved a 59% loss. Short EMAs sit far below long ones, a textbook downtrend. RSI hovers near 20 on both 4H and daily, flagging deep oversold conditions.
Key level: 0.010. If $WTC closes below this on the 4H, the next target is the mid‑0.009s – essentially air. A rebound to 0.011 would be a relief bounce, not a recovery. The daily chart still holds an unfilled gap from 0.054‑0.058 overhead.
Tap $WTC to pull up the chart and see how thin the order book looks at these levels.
What level are you watching for the first sign of a real floor? 👇
Not financial advice. DYOR.
Follow for the next read on this chart.
#WTC #Crypto #Altcoins #BinanceSquare
A 57% single‑day collapse leaves price stuck at the 0.010 area – a level that hasn’t mattered since listing. No futures positions remain, funding is zero, open interest is nil – this isn’t a liquidation cascade, it’s pure spot selling driven by conviction.
The 4H chart shows nine red candles out of twelve; the latest carved a 59% loss. Short EMAs sit far below long ones, a textbook downtrend. RSI hovers near 20 on both 4H and daily, flagging deep oversold conditions.
Key level: 0.010. If $WTC closes below this on the 4H, the next target is the mid‑0.009s – essentially air. A rebound to 0.011 would be a relief bounce, not a recovery. The daily chart still holds an unfilled gap from 0.054‑0.058 overhead.
Tap $WTC to pull up the chart and see how thin the order book looks at these levels.
What level are you watching for the first sign of a real floor? 👇
Not financial advice. DYOR.
Follow for the next read on this chart.
#WTC #Crypto #Altcoins #BinanceSquare