Everyone sees a 63% crash and expects a dead-cat bounce. The chart disagrees.
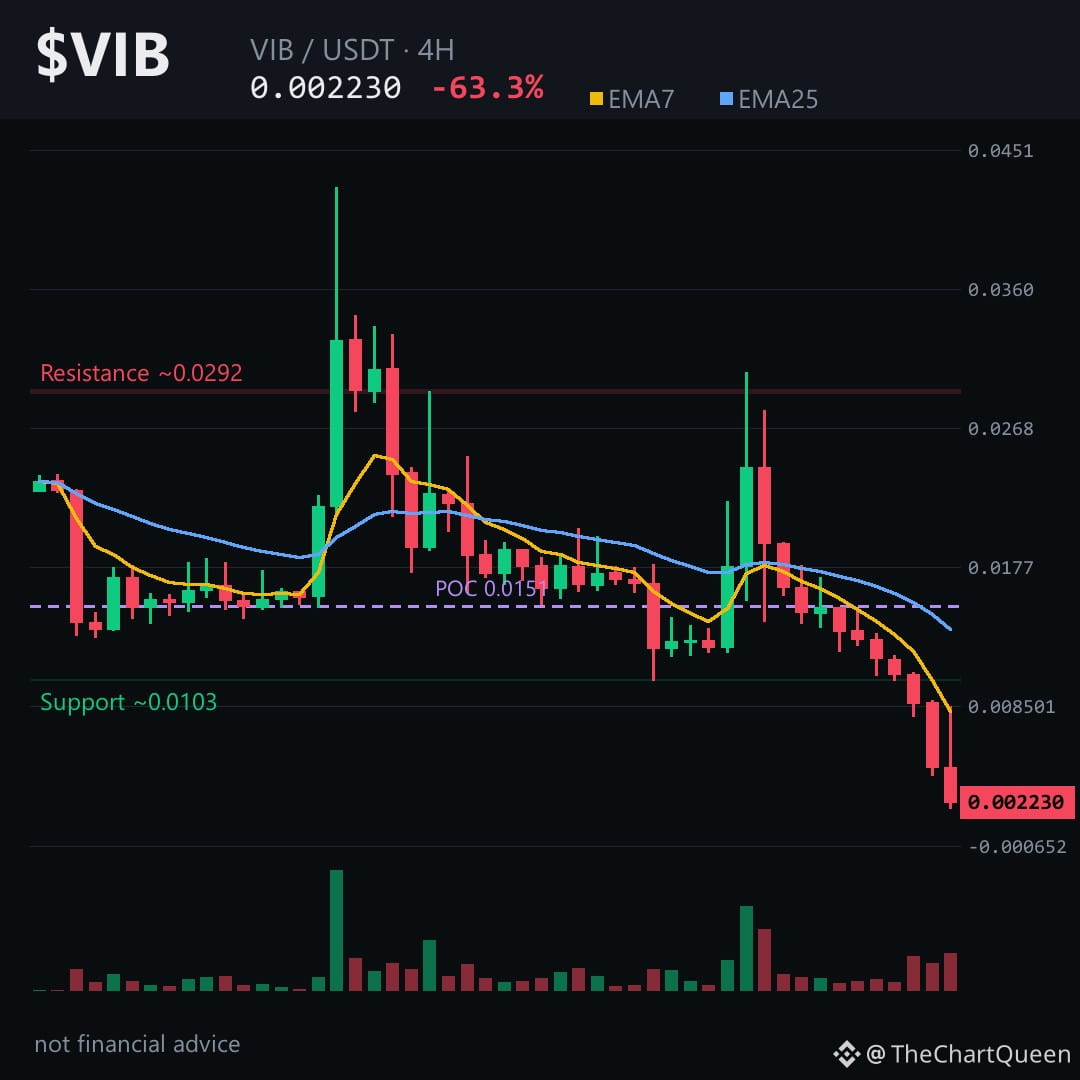
$VIB just printed two consecutive 50% down candles — the last one closing at 0.00223 after tagging 0.0018. That's not a flush. That's a stairway with no railings, and the 4H structure shows no fight from buyers at all.
The 4H read is brutally simple: price sits under every moving average, RSI is buried near 28, and there's a bearish gap unfilled just above — the 0.0089 to 0.0102 zone. That's the ceiling. As long as $VIB trades below it, any bounce is noise, not recovery.
The level to watch is the current pivot around 0.00224. Lose that and the objective sits near 0.00204 — but honestly, the volume profile says bigger demand only appears much lower. The invalidation is clean: a 4H close above 0.00235 and the immediate bearish pressure fades. Until then, sellers own this tape. Tap $VIB and zoom out — the weekly chart is even uglier.
My read: the crowd wants a reversal because the number looks cheap. The chart says cheap can get cheaper. I'd rather wait for structure to form than catch a falling knife.
Follow me — if VIB reclaims that 0.00235 area, the follow-up changes tone fast.
What level are you watching on VIB right now? 👇
⚠️ Not financial advice. DYOR.
#VIB #Crypto #BinanceSquare #Altcoins
$VIB just printed two consecutive 50% down candles — the last one closing at 0.00223 after tagging 0.0018. That's not a flush. That's a stairway with no railings, and the 4H structure shows no fight from buyers at all.
The 4H read is brutally simple: price sits under every moving average, RSI is buried near 28, and there's a bearish gap unfilled just above — the 0.0089 to 0.0102 zone. That's the ceiling. As long as $VIB trades below it, any bounce is noise, not recovery.
The level to watch is the current pivot around 0.00224. Lose that and the objective sits near 0.00204 — but honestly, the volume profile says bigger demand only appears much lower. The invalidation is clean: a 4H close above 0.00235 and the immediate bearish pressure fades. Until then, sellers own this tape. Tap $VIB and zoom out — the weekly chart is even uglier.
My read: the crowd wants a reversal because the number looks cheap. The chart says cheap can get cheaper. I'd rather wait for structure to form than catch a falling knife.
Follow me — if VIB reclaims that 0.00235 area, the follow-up changes tone fast.
What level are you watching on VIB right now? 👇
⚠️ Not financial advice. DYOR.
#VIB #Crypto #BinanceSquare #Altcoins