
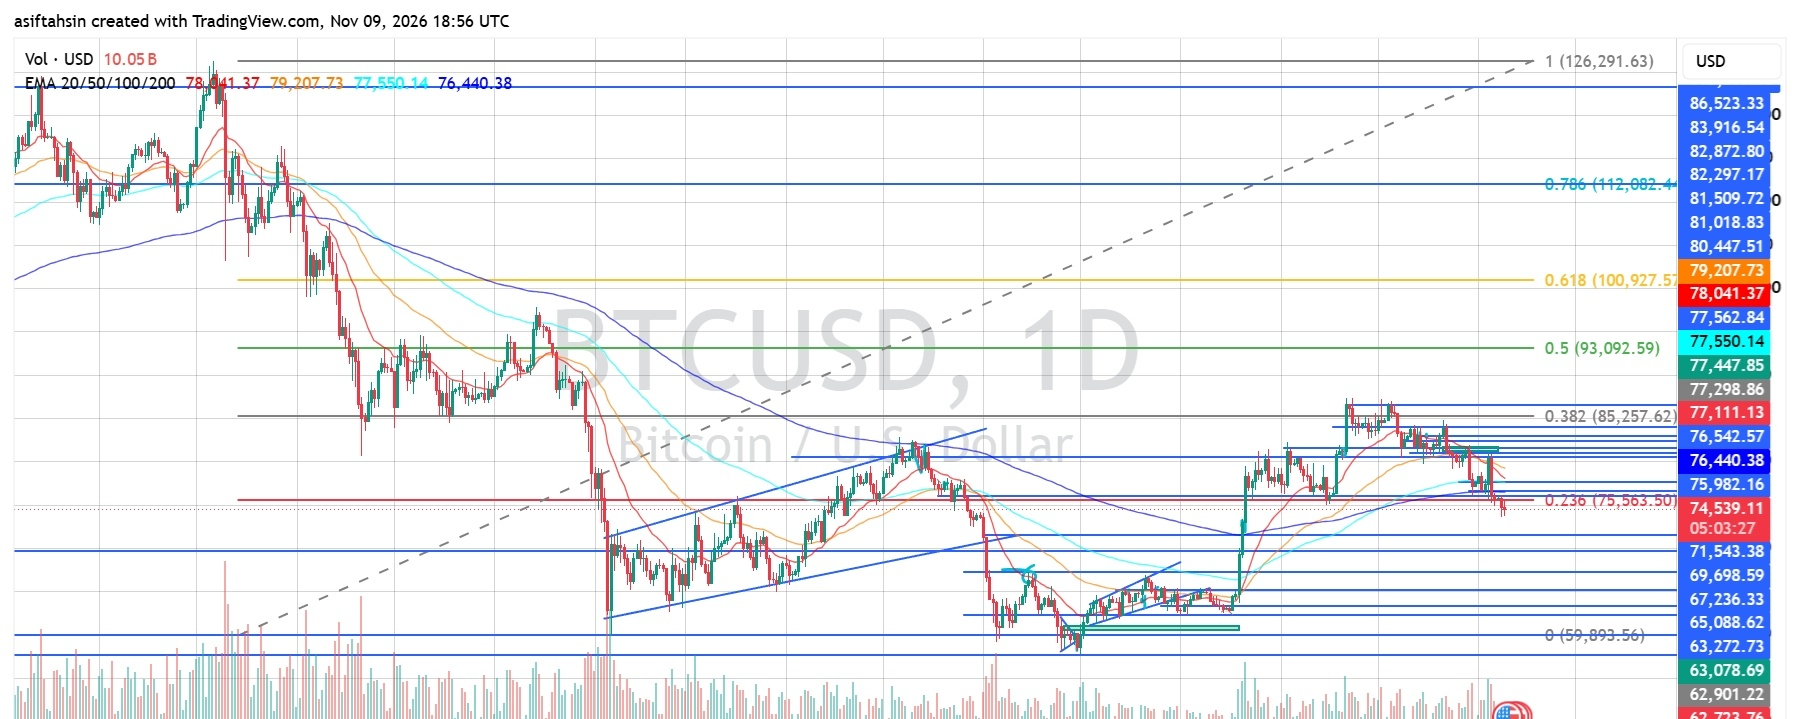

Bitcoin is trading around $74,539–$74,555, showing renewed selling pressure after failing to sustain its October recovery. Price has dropped below the major moving averages and the 0.236 Fibonacci level near $75,503, putting the market in a vulnerable position.
The daily structure is currently bearish. RSI is approaching oversold territory, but buyers have not yet shown a convincing reversal. Bitcoin needs to reclaim nearby resistance levels before a meaningful recovery can develop.
📊 EMA Structure – Bearish Alignment
All four major EMAs are currently above the market:
- 20 EMA: $78,042
- 50 EMA: $79,208
- 100 EMA: $77,550
- 200 EMA: $76,440
BTC is trading below all four EMAs, indicating strong downside pressure.
The $76,440–$79,208 region now acts as a major resistance zone. Reclaiming this area would be an important first step toward improving the daily structure.
📐 Fibonacci Levels – Recovery Faces Heavy Resistance
Based on the chart's Fibonacci retracement:
- 0.236: $75,503
- 0.382: $85,258
- 0.5: $93,093
- 0.618: $100,928
- 0.786: $112,082
- 1.0: $126,292
BTC has fallen below the 0.236 retracement level at $75,503. This level needs to be reclaimed to improve the short-term outlook.
The higher Fibonacci levels remain potential recovery targets, but they require a sustained change in market structure.
🚀 Bullish Recovery Scenario
For buyers to regain control, BTC first needs to reclaim $75,503 and establish acceptance above it.
Potential upside levels:
- $76,440 – 200 EMA
- $77,550 – 100 EMA
- $78,042 – 20 EMA
- $79,208 – 50 EMA
- $81,018 – Next resistance area
- $83,916 – Major recovery target
A sustained move above $79,208 would provide a stronger recovery signal. Until then, upside moves may face selling pressure.
🔄 Bearish Continuation Scenario
If BTC remains below $75,503 and selling pressure continues, the next downside areas to monitor are:
- $74,500 – Immediate price area
- $71,543 – Nearby support
- $69,699 – Next support zone
- $67,236 – Historical support
- $65,089 – Lower demand area
- $63,273–$62,285 – Major support region
- $59,936 – Broader Fibonacci support
A sustained daily breakdown below $71,543 could expose the lower support zones, particularly if selling volume increases.
📊 RSI Momentum – Bearish Pressure
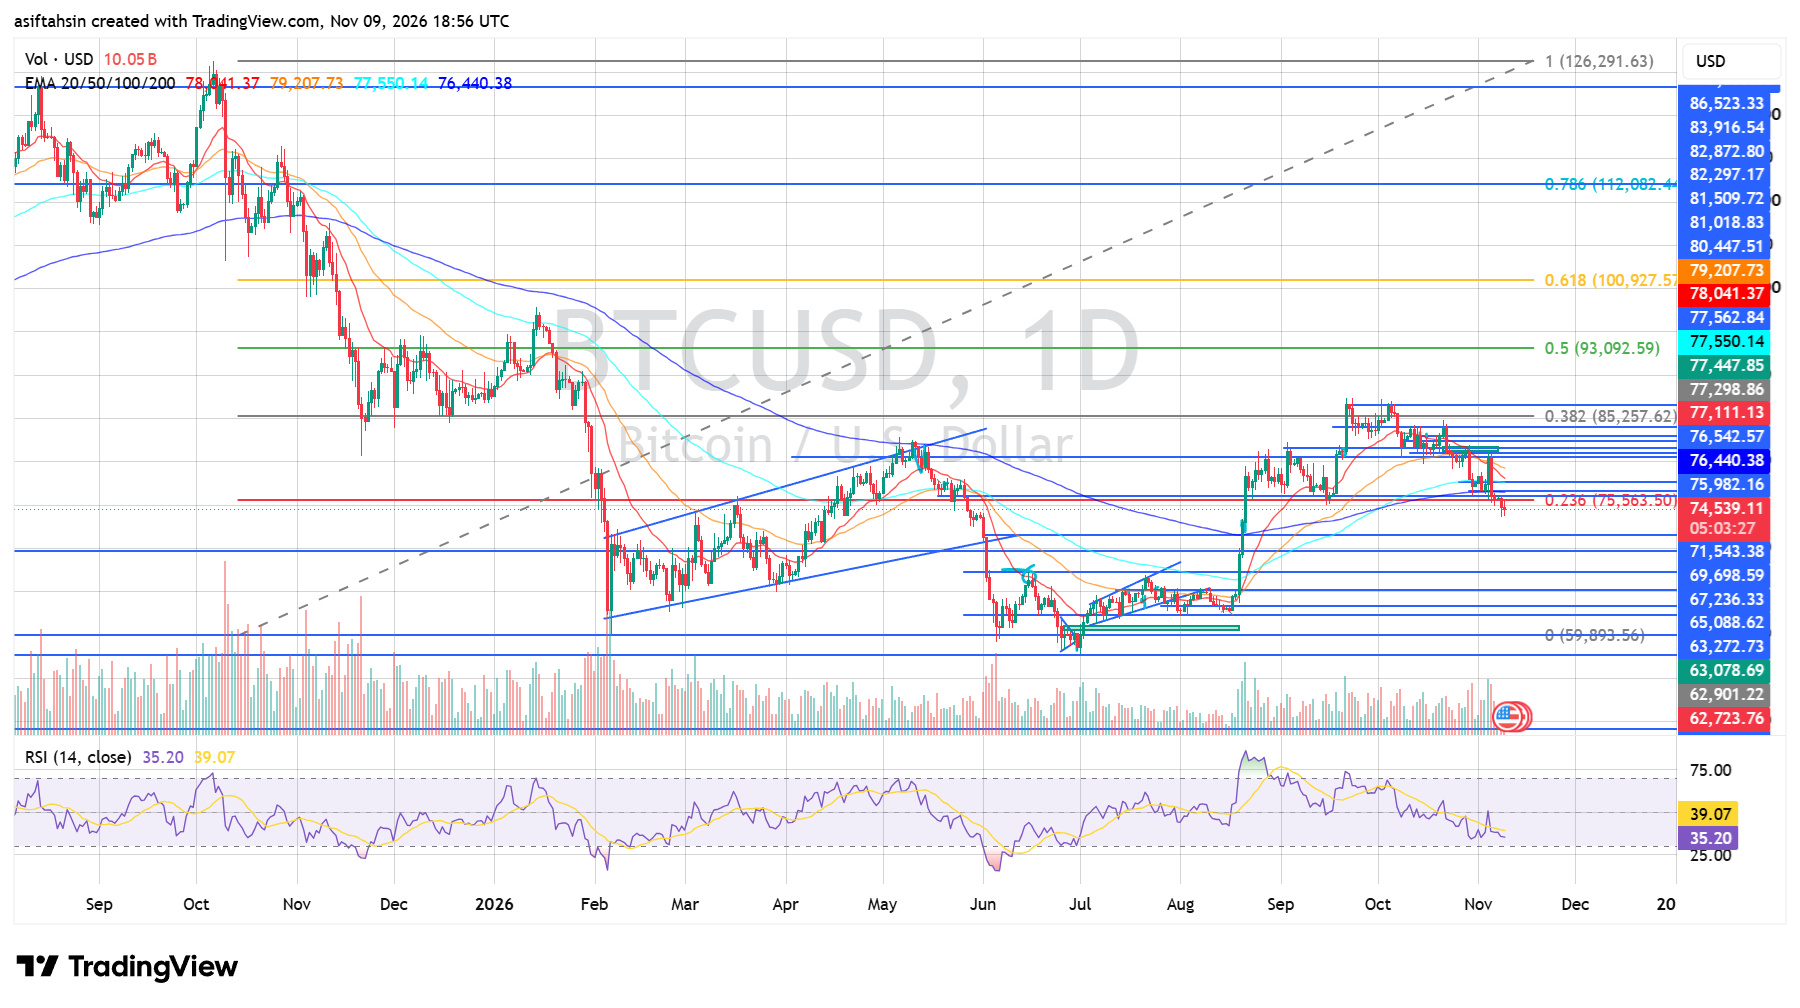
The daily RSI is around 35.20, while its signal average is near 39.07.
Momentum remains weak and is approaching oversold territory. This suggests sellers currently have the advantage, although a short-term relief bounce is possible.
An RSI recovery above 40–50 would help confirm improving momentum, especially if supported by a price reclaim of the EMAs.
📈 Market Structure & Liquidity
Bitcoin's recent recovery toward the $80K–$85K region has weakened significantly. Price has formed lower highs and moved below several important support levels.
The latest breakdown below $75,503 reinforces the bearish daily structure. The $71,543 area is now important to monitor for a potential reaction from buyers.
A strong recovery above $76,440–$78,042 would be needed to reduce immediate bearish pressure.
🔑 Key Levels to Watch
Resistance:
- $75,503
- $76,440
- $77,550
- $78,042
- $79,208
- $81,018
- $83,916
- $85,258
Support:
- $74,500
- $71,543
- $69,699
- $67,236
- $65,089
- $63,273–$62,285
- $59,936
🎯 Final Outlook
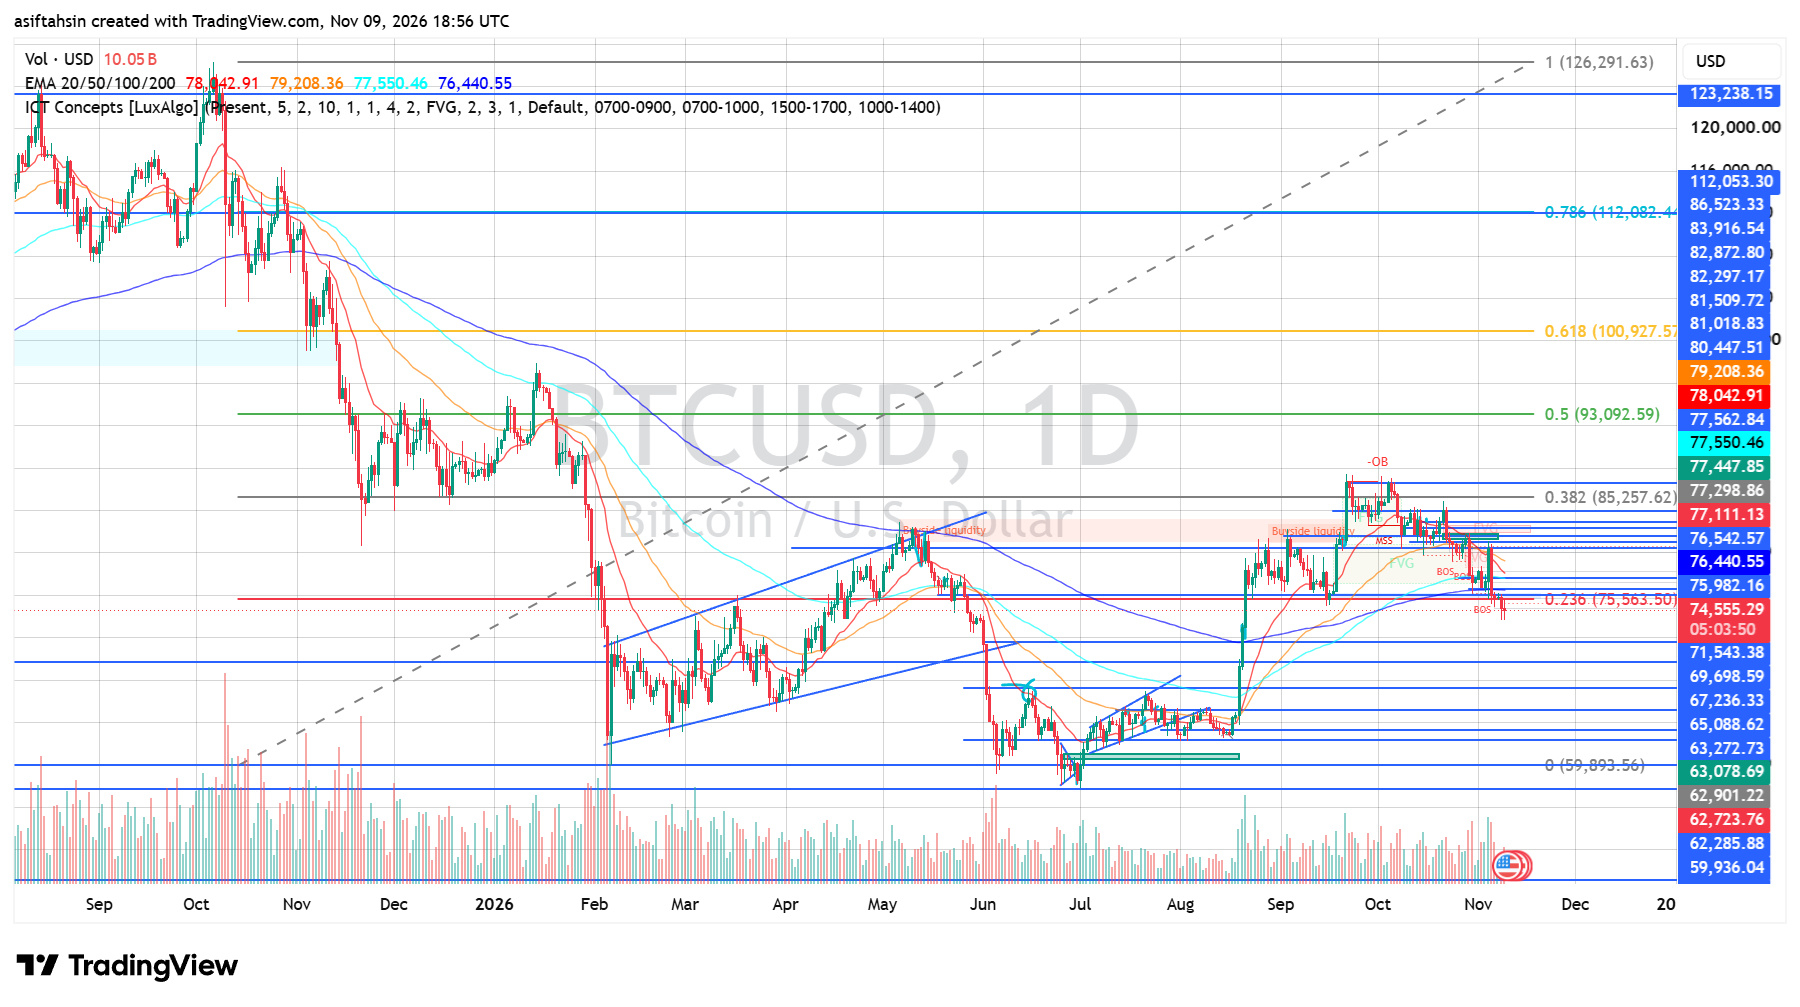
BTC's daily trend remains bearish while price stays below the $76,440–$79,208 EMA resistance zone.
A reclaim of $75,503 would be the first sign of stabilization, while a move above $79,208 could open the door toward $81K–$83.9K.
On the downside, losing $71,543 could increase the risk of a deeper correction toward $69,699 and $67,236.
Current Bias: Bearish | RSI Near Oversold | Recovery Requires EMA Reclamation
