
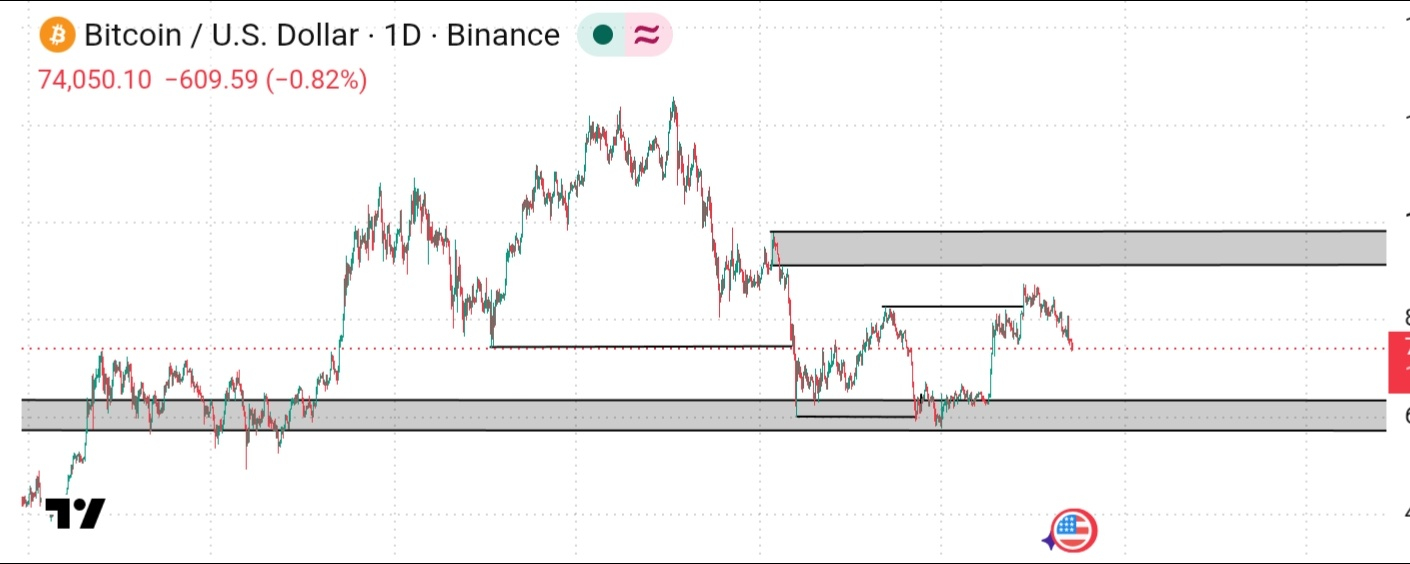

#Bitcoin is once again testing the nerves of every trader and investor. The daily $BTC /USD chart of the market that has already lived through extreme highs near and above $120,000, sharp corrections, and multi-month consolidations. As of the latest reading, Bitcoin trades around $74,050, down roughly 0.82% on the session, sitting right at a critical inflection zone that could decide the next multi-week (or multi-month) direction.
This isn’t just another pullback. The chart structure, marked support/resistance zones, and current price action suggest Bitcoin is coiled tightly. Millions of eyes are watching the same levels you see drawn on the chart. Here’s a professional technical breakdown of what the chart is really saying — and a clear, scenario-based prediction for Bitcoin’s next move.
What the Chart Clearly Shows
The daily timeframe reveals several high-probability technical features:
· Major upper resistance zone (gray box near $95,000–$100,000): This area previously acted as a significant supply zone after the powerful rally that took Bitcoin toward the $120,000 region. Price was decisively rejected there, confirming heavy selling interest.
· Mid-chart horizontal levels and small rectangles: These appear to mark prior consolidation ranges and potential order blocks or fair value gaps around the mid-$70,000s to low $80,000s. Price has already tested and reacted to several of these.
· Lower support band (gray box roughly $60,000–$65,000): A strong historical demand zone that has held during deeper corrections. This remains the primary downside magnet if intermediate supports fail.
· Current price action: Bitcoin is trading near $74,050 after a series of lower highs and a recent rejection from the mid-$80,000s. The red dashed line at the current price highlights the immediate battle line. Volume and candlestick structure show hesitation — neither bulls nor bears have full control yet.
Overall structure on the daily chart leans corrective after the earlier blow-off highs. Momentum indicators across the broader market (RSI in the mid-30s range in recent analyses) confirm weakening short-term strength, while longer-term moving averages still provide a floor in the low-to-mid $70,000s.
Next Bitcoin Price Move: Scenario-Based Prediction
Base Case (Highest Probability – 50-55%): Range-bound or mild recovery toward $78,000–$82,000
If Bitcoin defends the $73,000–$74,500 zone (especially a daily close back above $75,000–$76,000), expect a relief bounce. Short-term holders’ average cost basis and multiple technical confluences sit in this area. A successful defense opens the path to $80,000–$82,000 first, then a test of $85,000–$87,000 if momentum improves. This matches several November 2026 outlooks that see the $76,000 level as the pivot.
Bullish Scenario (25-30%): Breakout and run toward $90,000+
A clean daily close above $82,000 with expanding volume would flip the short-term structure. Targets then become the upper gray resistance box near $95,000–$100,000. Broader catalysts (improved ETF flows, macro risk-on sentiment) would be required to sustain this move. Longer-term forecasts for late 2026 still leave room for $87,000–$105,000 in base-to-bull cases
Bearish Scenario (20-25%): Breakdown toward $65,000–$60,000
Failure to hold $73,000–$74,000, followed by a close below $72,000, would likely trigger stops and accelerate selling into the major lower gray support box ($60,000–$65,000). This zone has historically attracted strong buying, but a flush lower cannot be ruled out in a risk-off environment. Several technical models flag $60,000 as a logical measured-move target if the current structure fully breaks..
Final Takeaway
Bitcoin at $74,050 is not randomly floating — it is testing a make-or-break cluster of support that has held multiple times on this chart. The next decisive daily or weekly close will likely set the tone into the end of 2026. Defend the low $70,000s and the path of least resistance turns higher. Lose it cleanly, and the lower demand box comes into play.