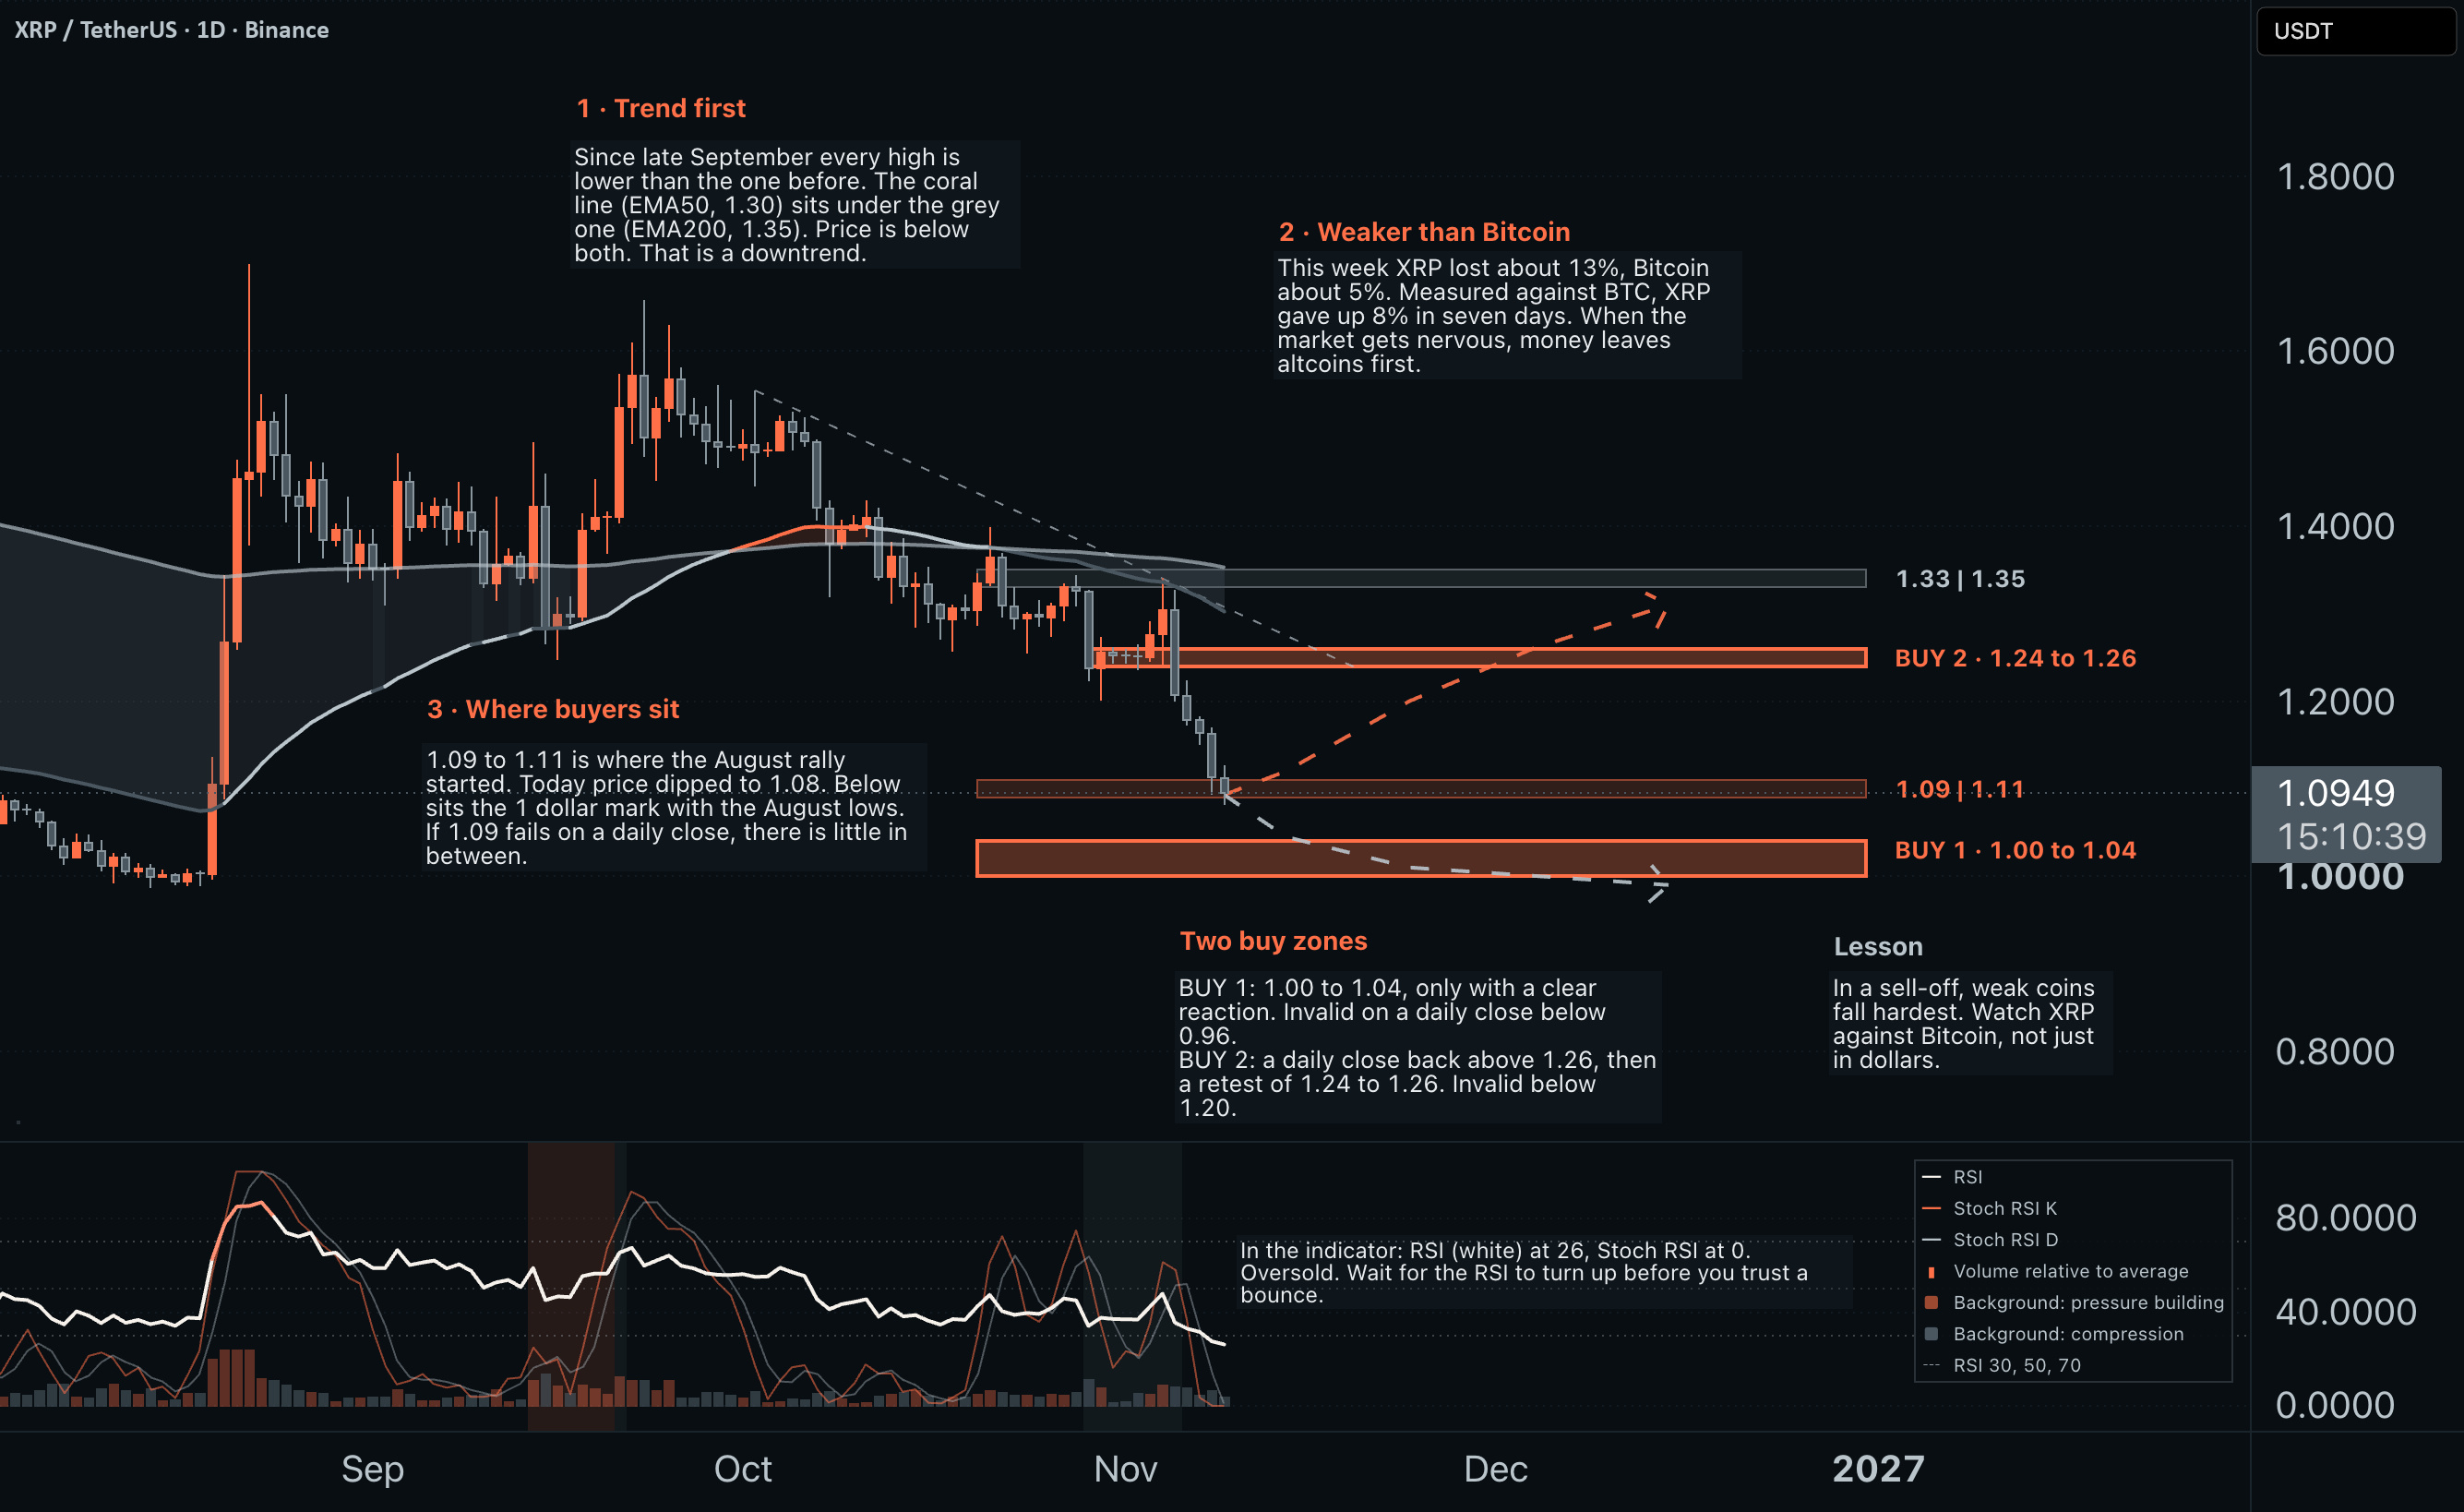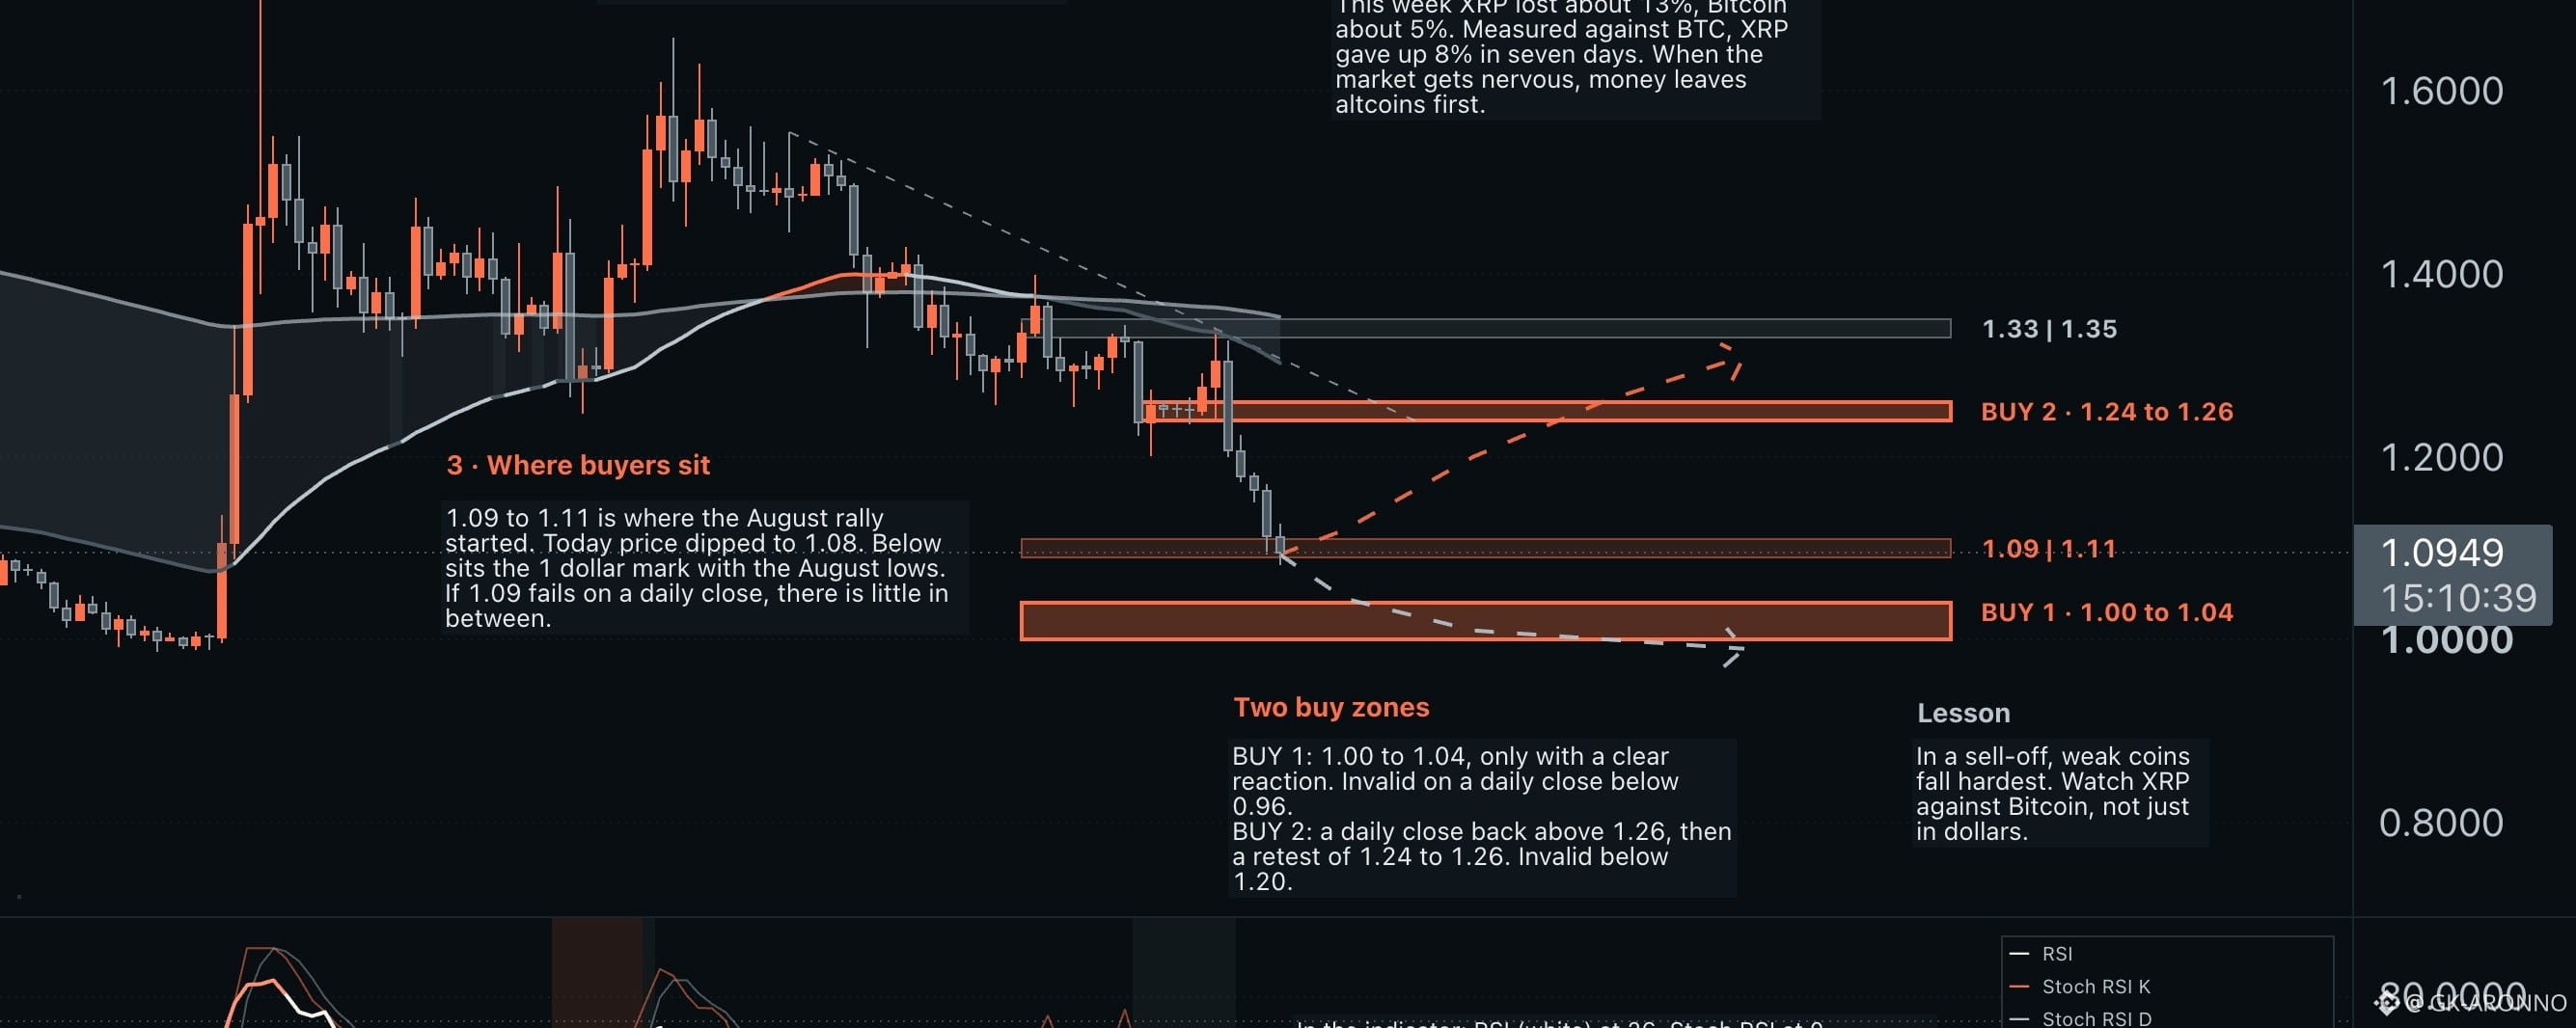


XRP fell harder than any other top 10 coin in this sell-off. Over the past seven days XRP lost about 13%, Bitcoin about 5%. Measured against BTC, XRP gave up 8% in a week.
What the chart shows:
1. Trend first: since late September every high is lower than the one before. The EMA50 (1.30) sits under the EMA200 (1.35), and price is below both.
2. Weaker than Bitcoin: when the market gets nervous, money leaves altcoins first.
3. Where buyers sit: 1.09 to 1.11 is where the August rally started. Today price dipped to 1.08. Below that sits the 1 dollar mark with the August lows. If 1.09 fails on a daily close, there is little in between.
Two buy zones:
BUY 1: 1.00 to 1.04, only with a clear reaction. Invalid on a daily close below 0.96.
BUY 2: a daily close back above 1.26, then a retest of 1.24 to 1.26. Invalid below 1.20.
Indicator: RSI at 26, Stoch RSI at 0. Oversold. Wait for the RSI to turn up before you trust a bounce.
Not financial advice. The zones are areas to watch, not entries on their own.