

Worked for 32s

### $BTC /USDC – $BTC Price Prediction


Bitcoin (BTC)
### $75,894.16
Screenshot: +0.12%
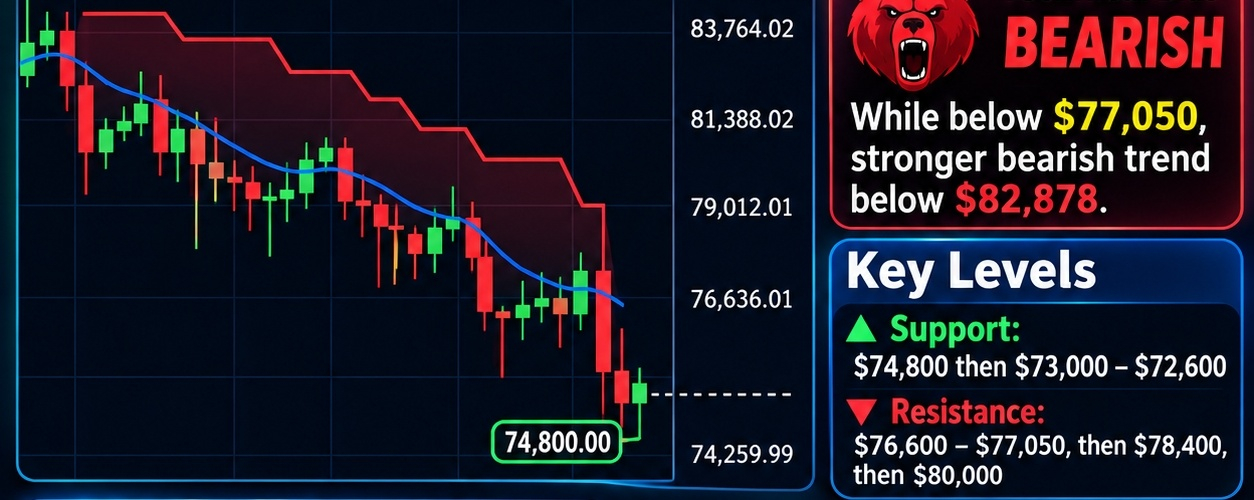
Daily trend: Strongly bearish
My initial verdict: Bitcoin is showing weakness. A small bounce is possible, but the chart does not yet confirm a bullish reversal.
### 1\. Technical analysis from your Binance chart
| Indicator | Value |
| ------------- | ------- |
| Current price | $75,894 |
| EMA (7) | $77,047 |
| Supertrend | $82,878 |
| Recent low | $74,800 |
| 24h high | $76,172 |
| 24h low | $74,800 |
Important observation: BTC is trading below both EMA 7 and Supertrend. Sellers currently have the advantage.
### 2\. International market and financial analysis
Recent reports around November 6–7 indicate:
* ETF selling: US Bitcoin ETFs saw over $430 million in outflows on November 5, with weekly withdrawals approaching $870 million. Investor's Business Daily +1
* Liquidations: Around $710 million in crypto positions were liquidated in 24 hours, including substantial Bitcoin long liquidations. Investor's Business Daily
* Global economy: US technology-stock weakness and interest-rate concerns are putting pressure on risk assets. Investor's Business Daily +1
* Geopolitical risk: Broader uncertainty can increase volatility, but I cannot verify a specific new war development as the direct cause of this BTC decline.
### 3\. Bitcoin price targets
My conditional forecast for the next 5–7 days, using your screenshot price as the reference.
| Scenario | BTC target |
| -------------------------- | --------------- |
| Base case | $74,800–$77,500 |
| Bearish breakdown | $73,000–$72,000 |
| Stronger bearish extension | $70,000 |
| Bullish recovery | $78,400–$80,000 |
| Major resistance | $82,000–$82,878 |
These downside levels are consistent with the recent market analysis from Reuters and other market reports. Reuters +2
My strongest prediction: Bearish
### 4\. Important trading levels
* $74,800: Critical support.
* $76,600–$77,050: First recovery resistance.
* $78,400: Important bullish confirmation.
* $80,000: Stronger bullish recovery level.
* $73,000–$72,000: Downside targets if support breaks.
### 5\. Bitcoin chart
Bitcoin (BTC)
### $75,907.00
+$101.00 (0.13%)
1D5D1M6MYTD1Y5YMAX
Open
-
Volume
-
Market Cap
-
Day Low
74,967
Year Low
57,945
EPS (TTM)
-
Day High
76,136
Year High
107,357
P/E Ratio
-
### Final verdict
My preferred scenario is a volatile sideways-to-bearish market, with $74,800 as the key level.
I would not consider BTC strongly bullish until it reclaims $77,050 and confirms above $78,400.
Do not enter a leveraged t
rade based on a prediction alone. Wait for a daily candle confirmation.
Educational analysis only, not financial advice.#JobsReportRaisesHikeOdds #US Data Center Rules May Constrain AI Expansion