

Worked for 37s

### $ETH H/USDC – Ethereum Price Prediction


### $2,241.51
Screenshot price: +0.49%
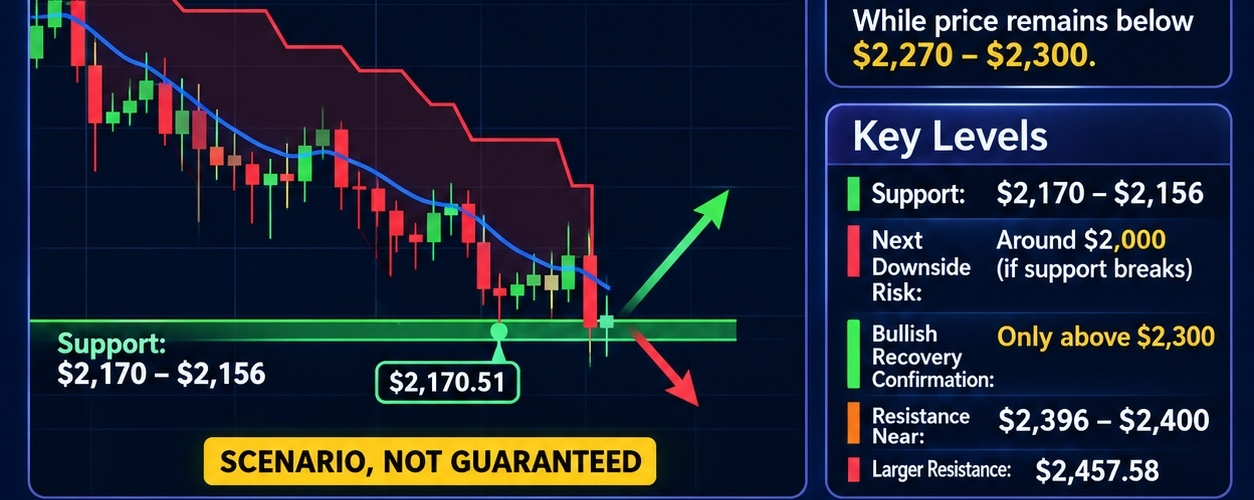
My technical verdict: Bearish trend, but a short-term recovery is possible.
Based on your 1-day Binance chart:
* EMA 7: $2,270.40 – price is below it.
* Supertrend: $2,487.58 – bearish signal.
* Recent swing low: $2,170.51.
* Immediate resistance: $2,270–$2,300.
* Major resistance: $2,396–$2,400.
The key level is $2,170. A daily close below it would increase downside risk. A sustained recovery above $2,300 would improve the bullish outlook.
### International market and financial conditions
The latest available reports show several bearish pressures:
* ETF flows: US spot ETH ETFs recorded approximately $99.9 million in outflows on November 5. IG UK
* Liquidations: October crypto liquidations reached approximately $6.22 billion, with long positions accounting for 68.7%. Gate Research
* Global markets: Technology-stock selling, inflation concerns, interest-rate expectations and geopolitical tensions are increasing risk-asset volatility. Reuters
* War risk: Oil-price volatility linked to Iran-related tensions could put further pressure on crypto if investors move away from risky assets. Reuters
A positive development would be renewed ETF inflows and improving Bitcoin market strength.
### My ETH price scenarios
These are conditional estimates, not guaranteed targets.
| Scenario | ETH target |
| ------------------- | ------------- |
| Base case | $2,170–$2,300 |
| Bearish breakdown | $2,100–$2,000 |
| Bullish recovery | $2,350–$2,400 |
| Stronger resistance | $2,487 |
Current bias: Bearish
My strongest view: ETH needs to reclaim $2,300 before I would consider a meaningful bullish reversal. Watch the $2,170–$2,156 support area very carefully. IG's November 6 analysis also identifies this as critical support. IG UK
### Live price chart
Ethereum (ETH)
### $2,241.35
+$11.02 (0.49%)
1D5D1M6MYTD1Y5YMAX
Open
-
Volume
-
Market Cap
-
Day Low
2,213.32
Year Low
1,512.07
EPS (TTM)
-
Day High
2,248.52
Year High
3,647.92
P/E Ratio
-
### Trading strategy
* Entry: Avoid chasing a trade; wait for confirmation around support.
* Bullish confirmation: Daily close above $2,300.
* Upside targets: $2,350, then $2,400.
* Bearish confirmation: Daily close below $2,156.
* Downside targets: $2,100, then $2,000.
* Risk management: Use a stop-loss and avoid excessive leverage.
Bottom line: I currently favor sideways-to-bearish movement until ETH reclaims $2,300. The $2,170 area is the critical level to watch. This is a technical scenario based on your screenshot and available market reports, no
t a guaranteed prediction.
I can also monitor ETH's daily trend, ETF flows and important support/resistance changes.#JobsReportRaisesHikeOdds #CPITestsDecemberRateOutlook #WillAnthropicListOnTime