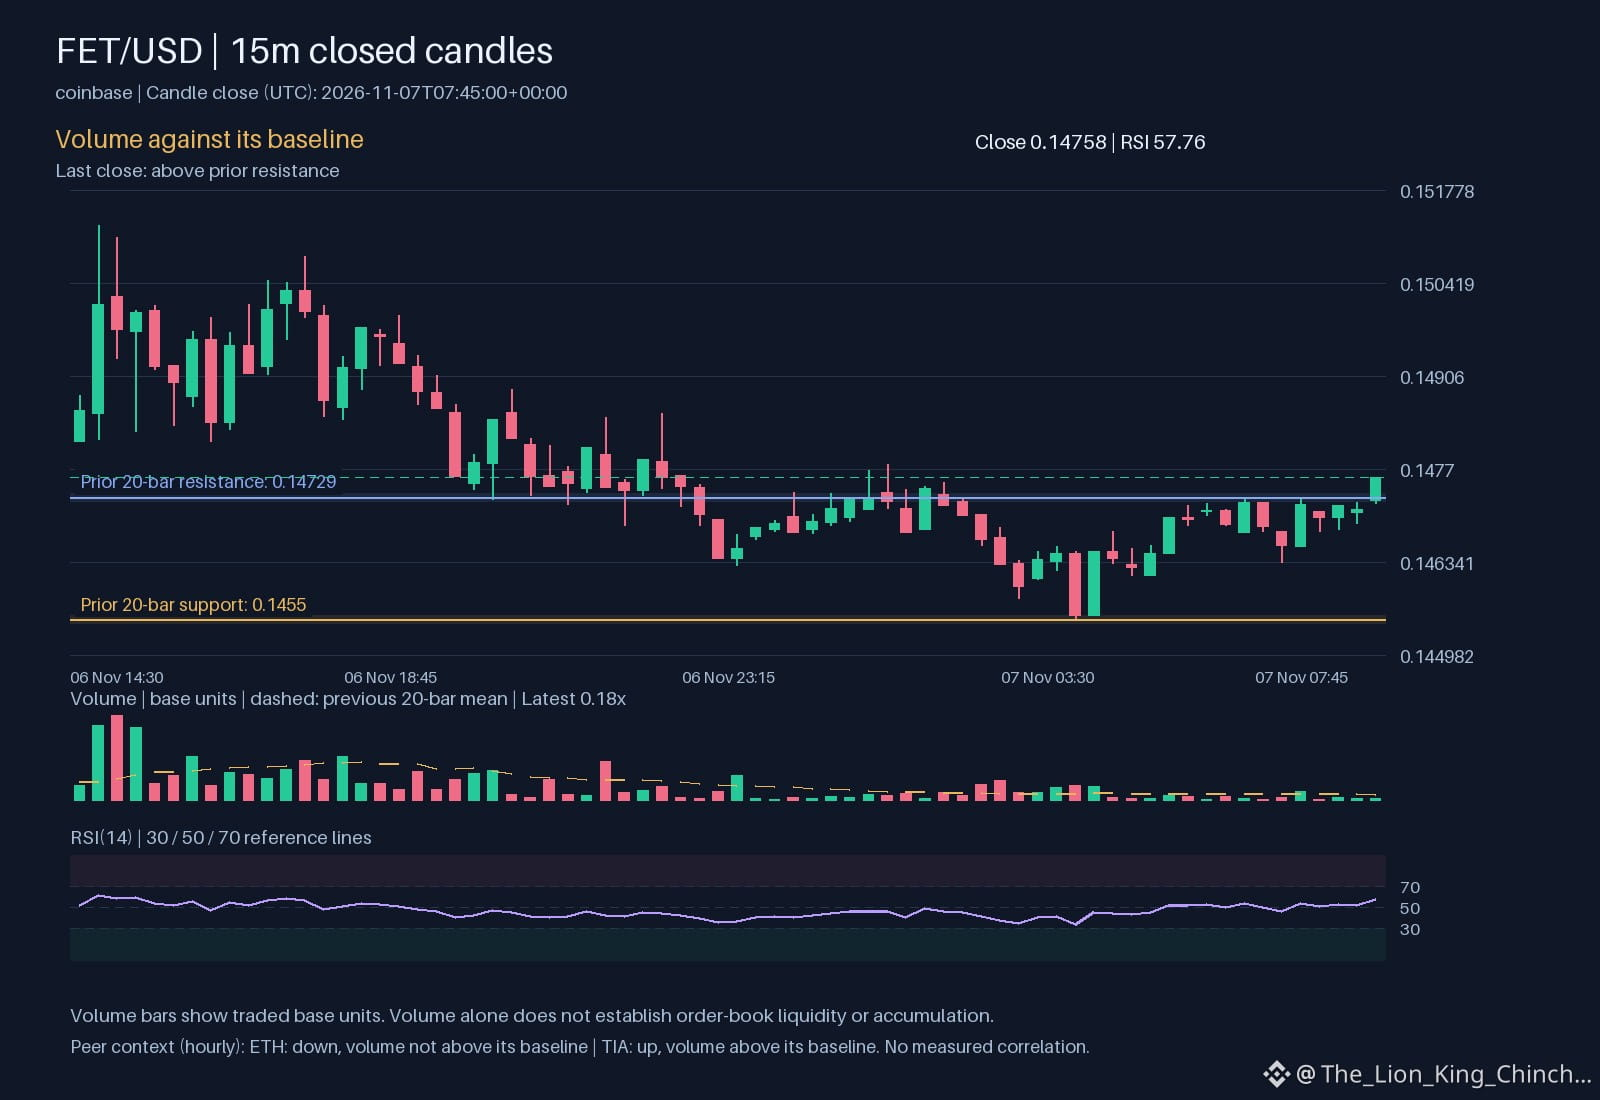
$FET: Direction vs Holding Strength in Hourly Moves
The primary asset $FET shows an hourly direction up while its hourly volume remains not above baseline. This suggests a move that is not strongly supported by buying pressure.
Peer observations add context. Ethereum ($ETH ) recorded an hourly direction down with volume also not above its baseline, indicating a weak downward shift. By contrast, TIA ($TIA ) moved hourly up and its volume was above baseline, a sign of stronger conviction behind the rise.
Comparing these cases highlights that the same venue can produce opposite directional signals with similar volume conditions. The key limit is that a shared direction does not prove any underlying link such as sector rotation or common catalyst. It merely reflects that each token faced its own order flow dynamics in the same time frame.
In this scenario, the question of whether direction or the ability of the move to hold matters more can be explored by looking at support and resistance levels. If $FET stays above the recent resistance zone, the upward direction may gain credibility despite low volume. If it falls back below that level, the lack of volume suggests the move was fragile.
A practical way to reassess is to monitor the next hourly candle for a reversal pattern or a break of the current support zone. A sustained hold above resistance would tilt the analysis toward direction being meaningful, while a quick pullback would emphasize the importance of holding strength. 😊
Probabilistic market research, not a recommendation or guaranteed return.
The comparison to keep in mind: $ETH has hourly direction down and volume not above its baseline; $TIA has hourly direction up and volume above its baseline. This alone does not establish correlation.
Which matters more in this comparison: direction or how the move holds?
#FET #ETH #TIA #CryptoWatchlist #CryptoLearning
The primary asset $FET shows an hourly direction up while its hourly volume remains not above baseline. This suggests a move that is not strongly supported by buying pressure.
Peer observations add context. Ethereum ($ETH ) recorded an hourly direction down with volume also not above its baseline, indicating a weak downward shift. By contrast, TIA ($TIA ) moved hourly up and its volume was above baseline, a sign of stronger conviction behind the rise.
Comparing these cases highlights that the same venue can produce opposite directional signals with similar volume conditions. The key limit is that a shared direction does not prove any underlying link such as sector rotation or common catalyst. It merely reflects that each token faced its own order flow dynamics in the same time frame.
In this scenario, the question of whether direction or the ability of the move to hold matters more can be explored by looking at support and resistance levels. If $FET stays above the recent resistance zone, the upward direction may gain credibility despite low volume. If it falls back below that level, the lack of volume suggests the move was fragile.
A practical way to reassess is to monitor the next hourly candle for a reversal pattern or a break of the current support zone. A sustained hold above resistance would tilt the analysis toward direction being meaningful, while a quick pullback would emphasize the importance of holding strength. 😊
Probabilistic market research, not a recommendation or guaranteed return.
The comparison to keep in mind: $ETH has hourly direction down and volume not above its baseline; $TIA has hourly direction up and volume above its baseline. This alone does not establish correlation.
Which matters more in this comparison: direction or how the move holds?
#FET #ETH #TIA #CryptoWatchlist #CryptoLearning