

BTCUSD – Technical Market Analysis (15M)
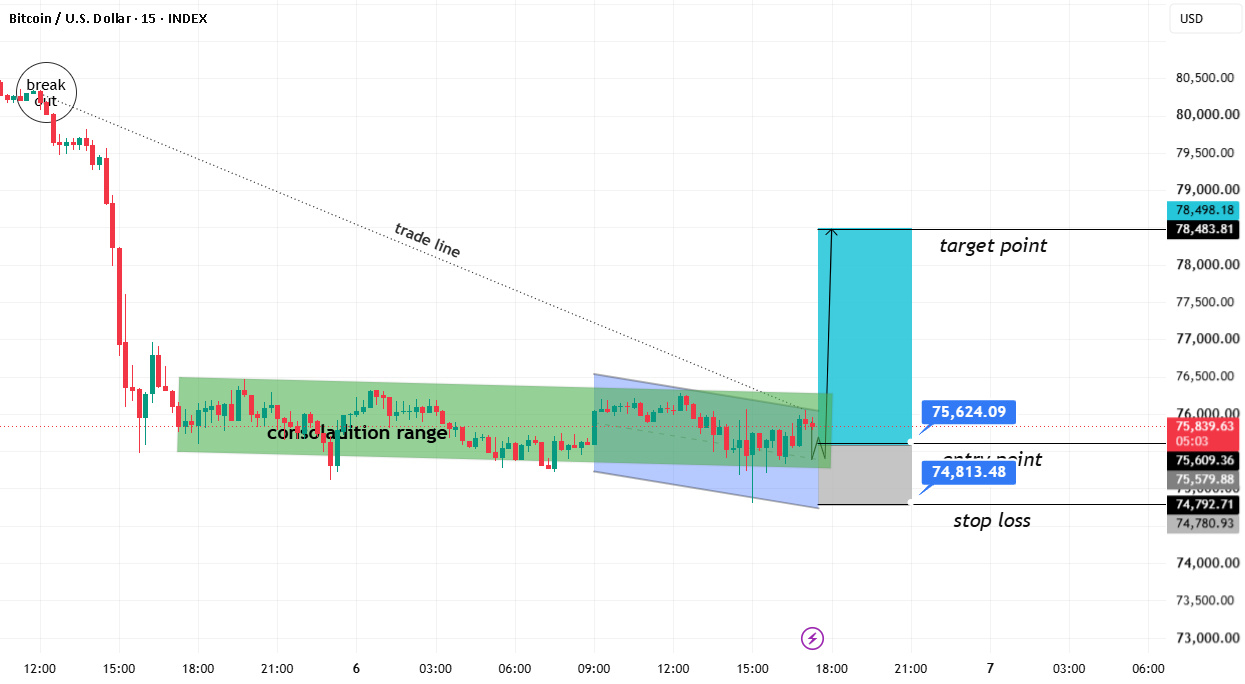
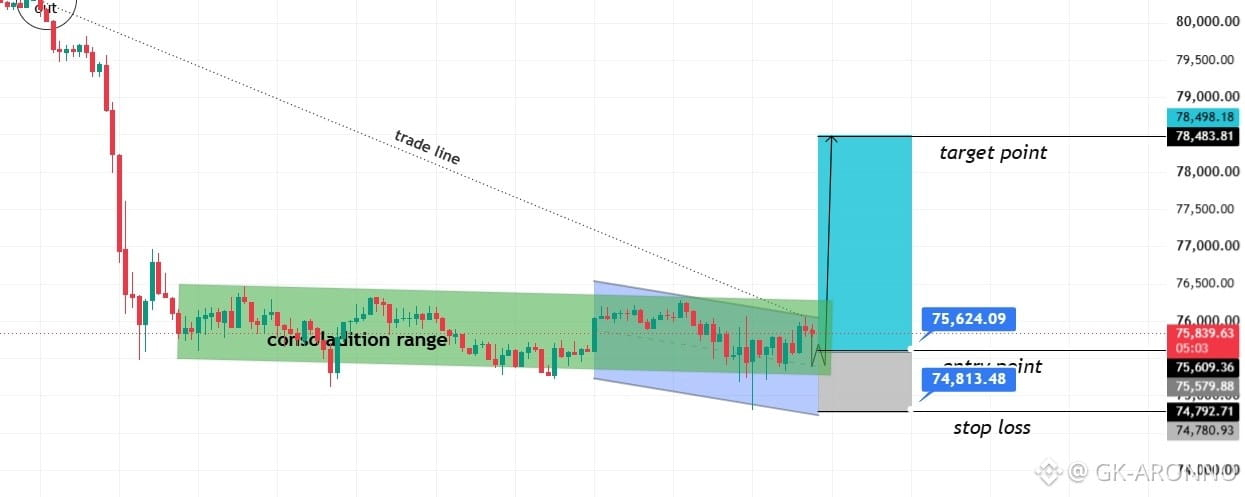
Market Structure: BTCUSD is trading around 75,830, consolidating after a strong bearish move from the 80,000 region. Price is forming a consolidation range while approaching a descending resistance trendline.
1. Trend & Market Structure
- Previous structure remains bearish.
- Price is consolidating between approximately 75,600 and 76,400.
- A descending trendline is acting as dynamic resistance.
- Buyers are attempting to build momentum for a bullish breakout.
- A confirmed breakout could trigger a strong upward move.
2. Key Support & Resistance
Level Price
Major resistance 76,400–76,500
Resistance 2 76,000
Support 1 75,600
Support 2 75,000
Major support 74,800
3. Liquidity Zones
- Buy-side liquidity: Above 76,400–76,500.
- Sell-side liquidity: Below 75,600.
- Major downside liquidity: Around 74,800.
4. Trade Setup – LONG
Conditional bullish bias
- Entry zone: 75,624–75,850
- Stop Loss: 74,793
Take Profit Targets:
Target Price
TP1 76,500
TP2 77,500
TP3 78,484
5. Confirmation & Invalidation
- A 15-minute candle closing above 76,400–76,500 would strengthen the bullish breakout scenario.
- A successful retest of the breakout zone could offer another long opportunity.
- A breakdown below 75,600 would weaken the bullish setup.
- A break below 74,793 invalidates the illustrated long setup.
Final Market Outlook
BTC is approaching an important decision zone. The descending trendline and consolidation range suggest a potential breakout opportunity. Buyers need to reclaim 76,400–76,500 to confirm bullish momentum.
Primary Bias: Bullish above confirmed breakout resistance.
Strategy: Wait for breakout and retest confirmation rather than chasing price;