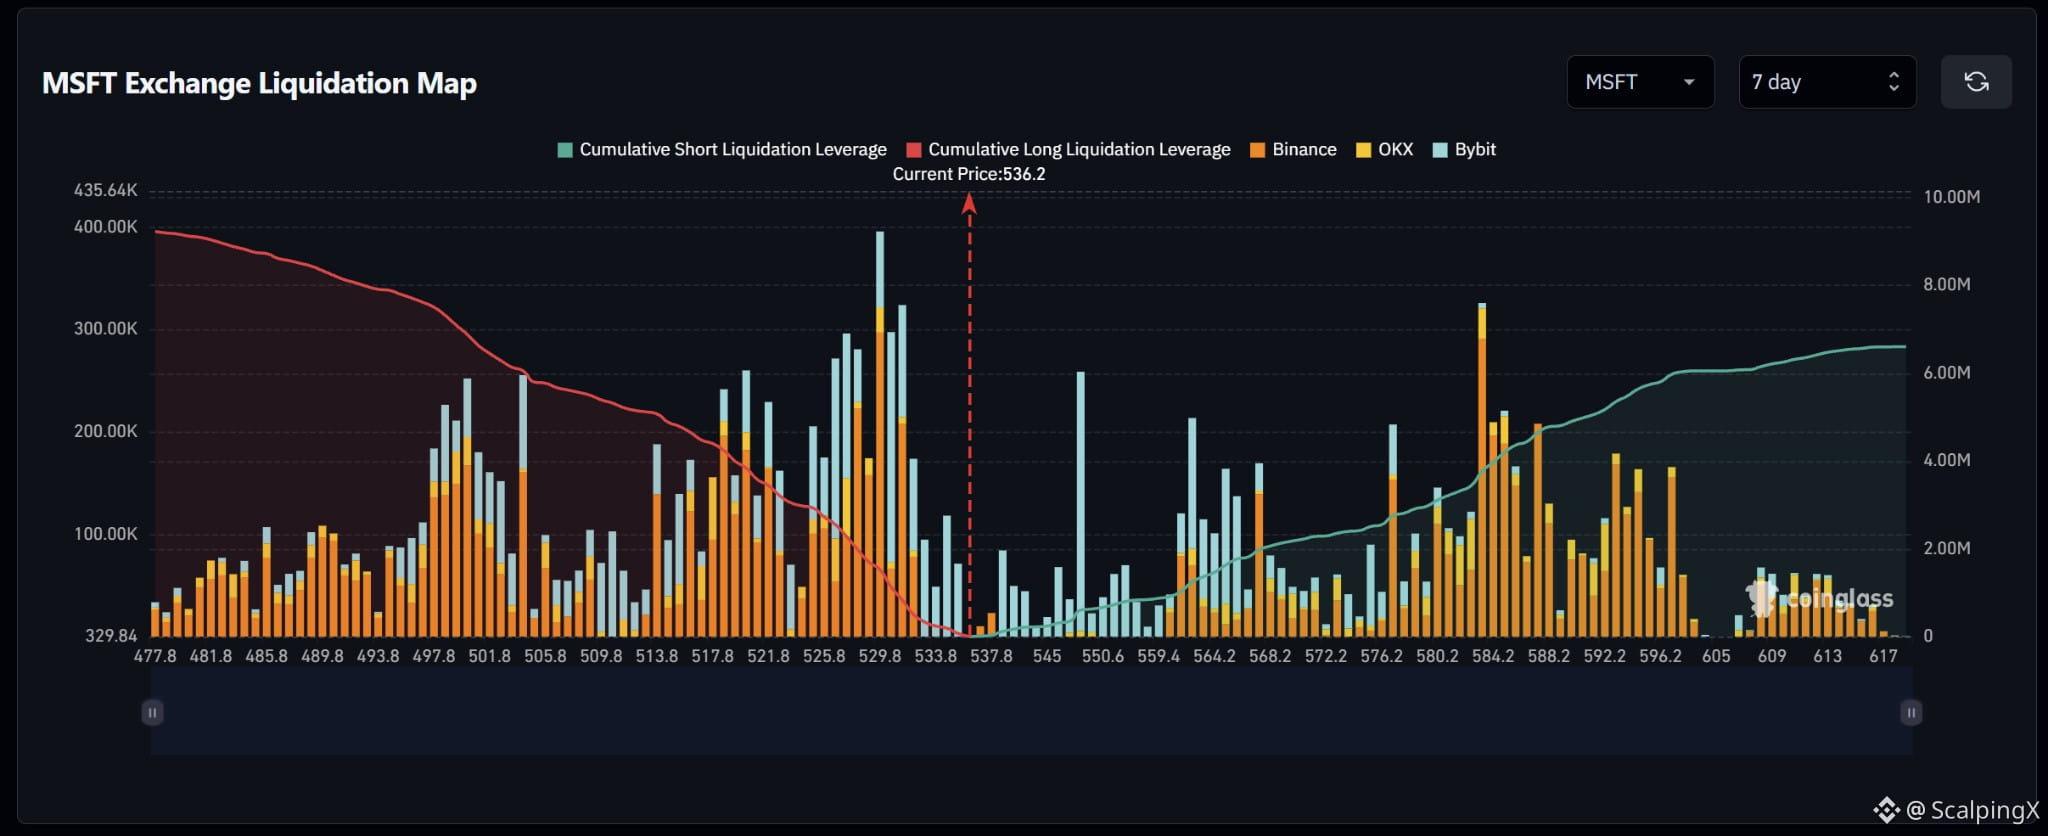
$MSFT – Liquidation Map (7 days) – Index ~536.2
🧭 The preferred scenario is a downside long-liquidation sweep at 532–534, followed by 526–532. Large long clusters sit closer to price than the short clusters. Estimated cumulative exposure is around $9.2M long versus $6.6M short within the displayed range.
🔻 Losing 534 without reclaiming it shifts attention to 529–532. The bar near 529.8 is the map’s largest, approaching $400,000; long liquidations here could amplify volatility.
🎯 Holding below 529 after the sweep brings 525–528, then 517–522, into focus. Conversely, a sweep of 532–534 followed by a quick reclaim of 536.2 would weaken the downside scenario.
⚖️ Clearing and holding above 545 shifts attention to short bars around 547–551, particularly near 547. The 552–559 range is sparse; subsequent clusters sit at 561–568 and 582–588. The large spike near 583 is notable but remains far from the snapshot price.
#LiquidationMap
🧭 The preferred scenario is a downside long-liquidation sweep at 532–534, followed by 526–532. Large long clusters sit closer to price than the short clusters. Estimated cumulative exposure is around $9.2M long versus $6.6M short within the displayed range.
🔻 Losing 534 without reclaiming it shifts attention to 529–532. The bar near 529.8 is the map’s largest, approaching $400,000; long liquidations here could amplify volatility.
🎯 Holding below 529 after the sweep brings 525–528, then 517–522, into focus. Conversely, a sweep of 532–534 followed by a quick reclaim of 536.2 would weaken the downside scenario.
⚖️ Clearing and holding above 545 shifts attention to short bars around 547–551, particularly near 547. The 552–559 range is sparse; subsequent clusters sit at 561–568 and 582–588. The large spike near 583 is notable but remains far from the snapshot price.
#LiquidationMap