
📉 Bitcoin ($BTC ) Market Update: Strong Selling Pressure Raises Caution
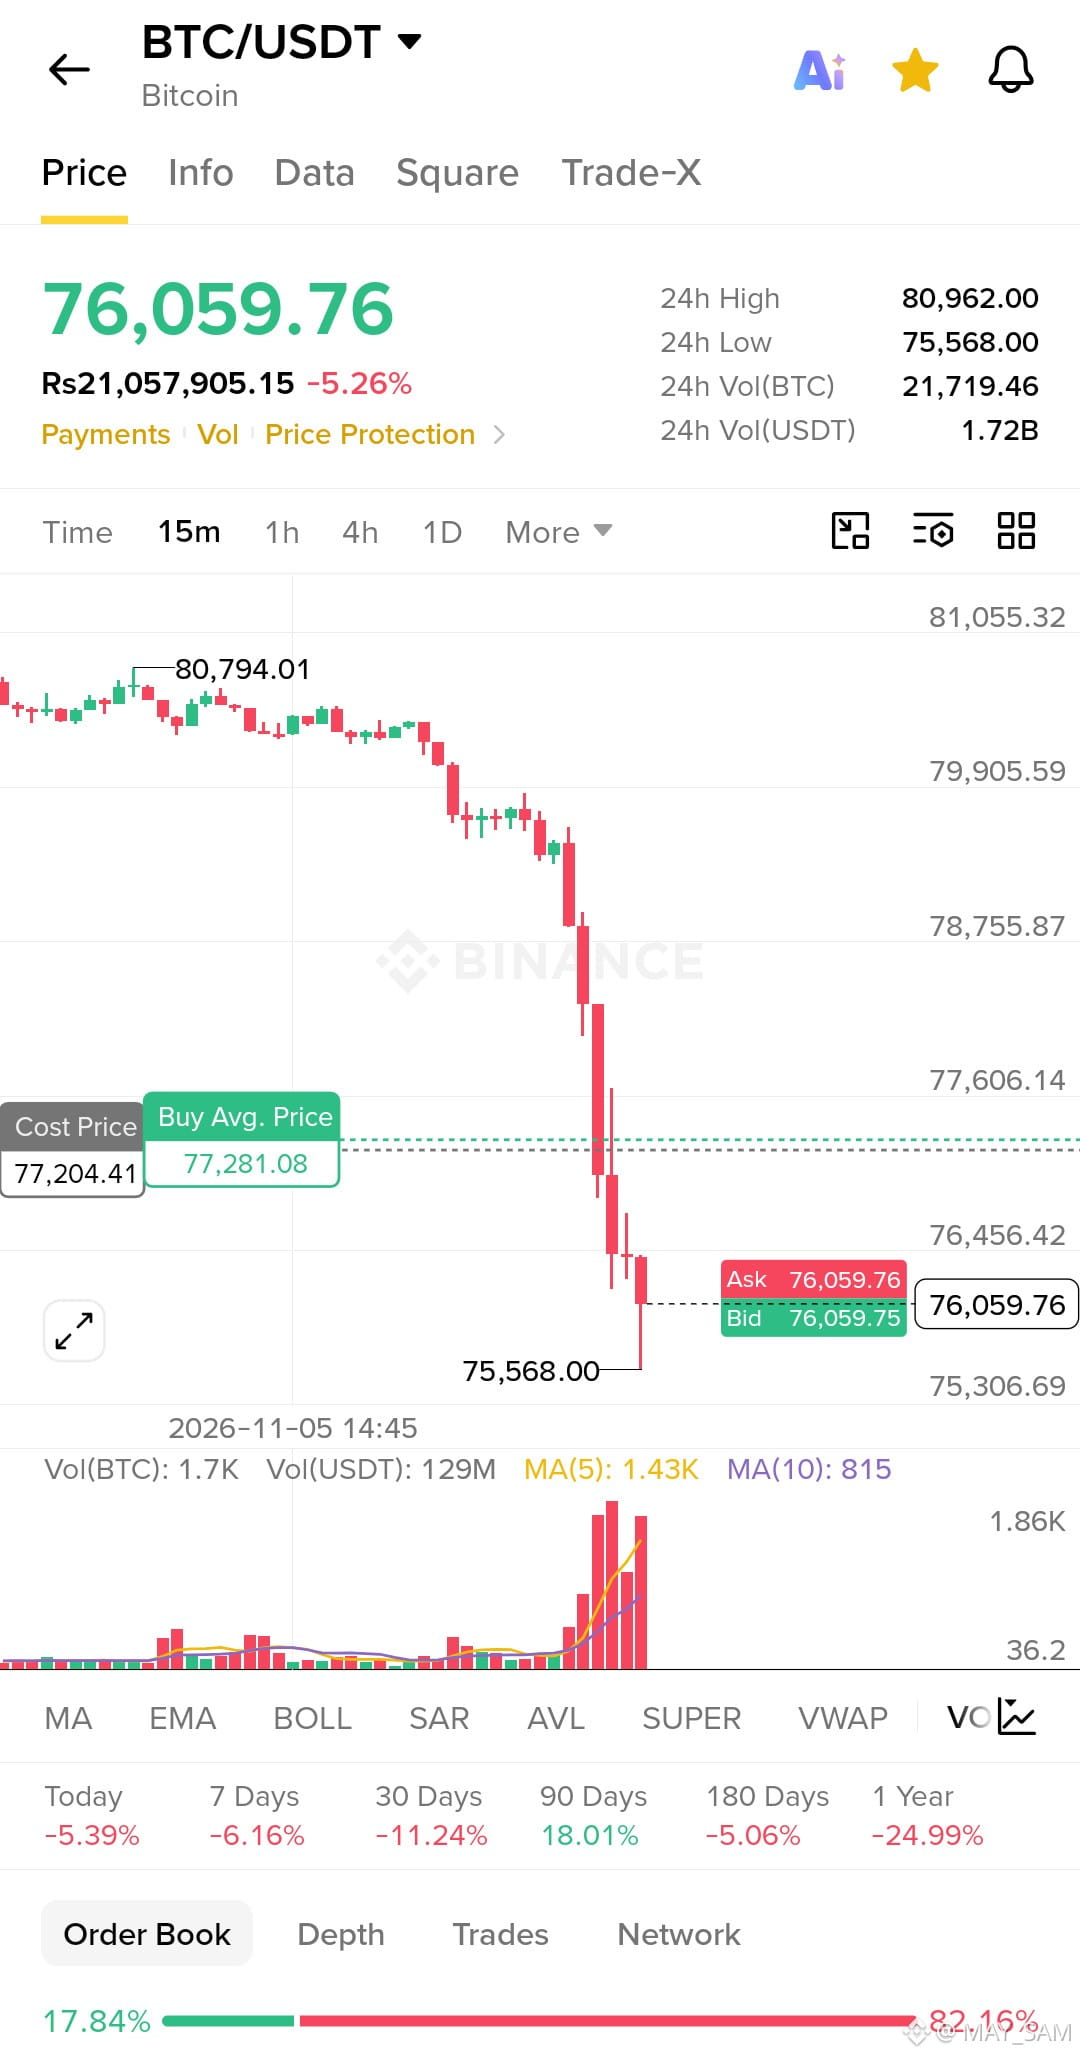
Bitcoin is experiencing significant downside pressure, with BTC/USDT trading around $76,059, down approximately 5.26% at the time of this chart snapshot.
The 15-minute chart highlights an aggressive sell-off, accompanied by a noticeable increase in trading volume. This suggests that sellers are currently dominating short-term market activity.
🔍 Key Market Observations:
🔴 Strong Bearish Momentum: Multiple consecutive red candles indicate aggressive selling pressure.
📊 Volume Spike: Trading volume increased sharply during the decline, suggesting heightened market participation.
⚖️ Order Book Imbalance: The displayed order book shows approximately 82.16% sell-side pressure versus 17.84% buy-side interest. This is a snapshot, not a guarantee of future price direction.
📌 Important Price Levels:
▫️ $75,568 – Immediate support / recent low
▫️ $76,456 – Near-term resistance area
▫️ $77,200–$77,280 – Potential recovery zone
▫️ $80,962 – 24-hour high and broader recovery reference
📚 What Should Traders Watch Next?
If Bitcoin holds above $75,568 and buying volume starts increasing, a short-term recovery could develop. However, a decisive breakdown below this support may create additional downside pressure.
For bullish confirmation, traders should watch whether BTC can reclaim nearby resistance levels with strong volume.
My Take: The current structure favors caution rather than aggressive buying. A single green candle does not confirm a trend reversal. Wait for confirmation, manage leverage carefully, and always protect your capital.
Remember: Successful trading is not about predicting every move; it's about managing risk and making informed decisions.$BTC
#BinanceReopensWithdrawalsForMoreAssets #btc70k $BTC
Bitcoin is experiencing significant downside pressure, with BTC/USDT trading around $76,059, down approximately 5.26% at the time of this chart snapshot.
The 15-minute chart highlights an aggressive sell-off, accompanied by a noticeable increase in trading volume. This suggests that sellers are currently dominating short-term market activity.
🔍 Key Market Observations:
🔴 Strong Bearish Momentum: Multiple consecutive red candles indicate aggressive selling pressure.
📊 Volume Spike: Trading volume increased sharply during the decline, suggesting heightened market participation.
⚖️ Order Book Imbalance: The displayed order book shows approximately 82.16% sell-side pressure versus 17.84% buy-side interest. This is a snapshot, not a guarantee of future price direction.
📌 Important Price Levels:
▫️ $75,568 – Immediate support / recent low
▫️ $76,456 – Near-term resistance area
▫️ $77,200–$77,280 – Potential recovery zone
▫️ $80,962 – 24-hour high and broader recovery reference
📚 What Should Traders Watch Next?
If Bitcoin holds above $75,568 and buying volume starts increasing, a short-term recovery could develop. However, a decisive breakdown below this support may create additional downside pressure.
For bullish confirmation, traders should watch whether BTC can reclaim nearby resistance levels with strong volume.
My Take: The current structure favors caution rather than aggressive buying. A single green candle does not confirm a trend reversal. Wait for confirmation, manage leverage carefully, and always protect your capital.
Remember: Successful trading is not about predicting every move; it's about managing risk and making informed decisions.$BTC
#BinanceReopensWithdrawalsForMoreAssets #btc70k $BTC