BNB/USDT Technical Analysis (November 5, 2026)
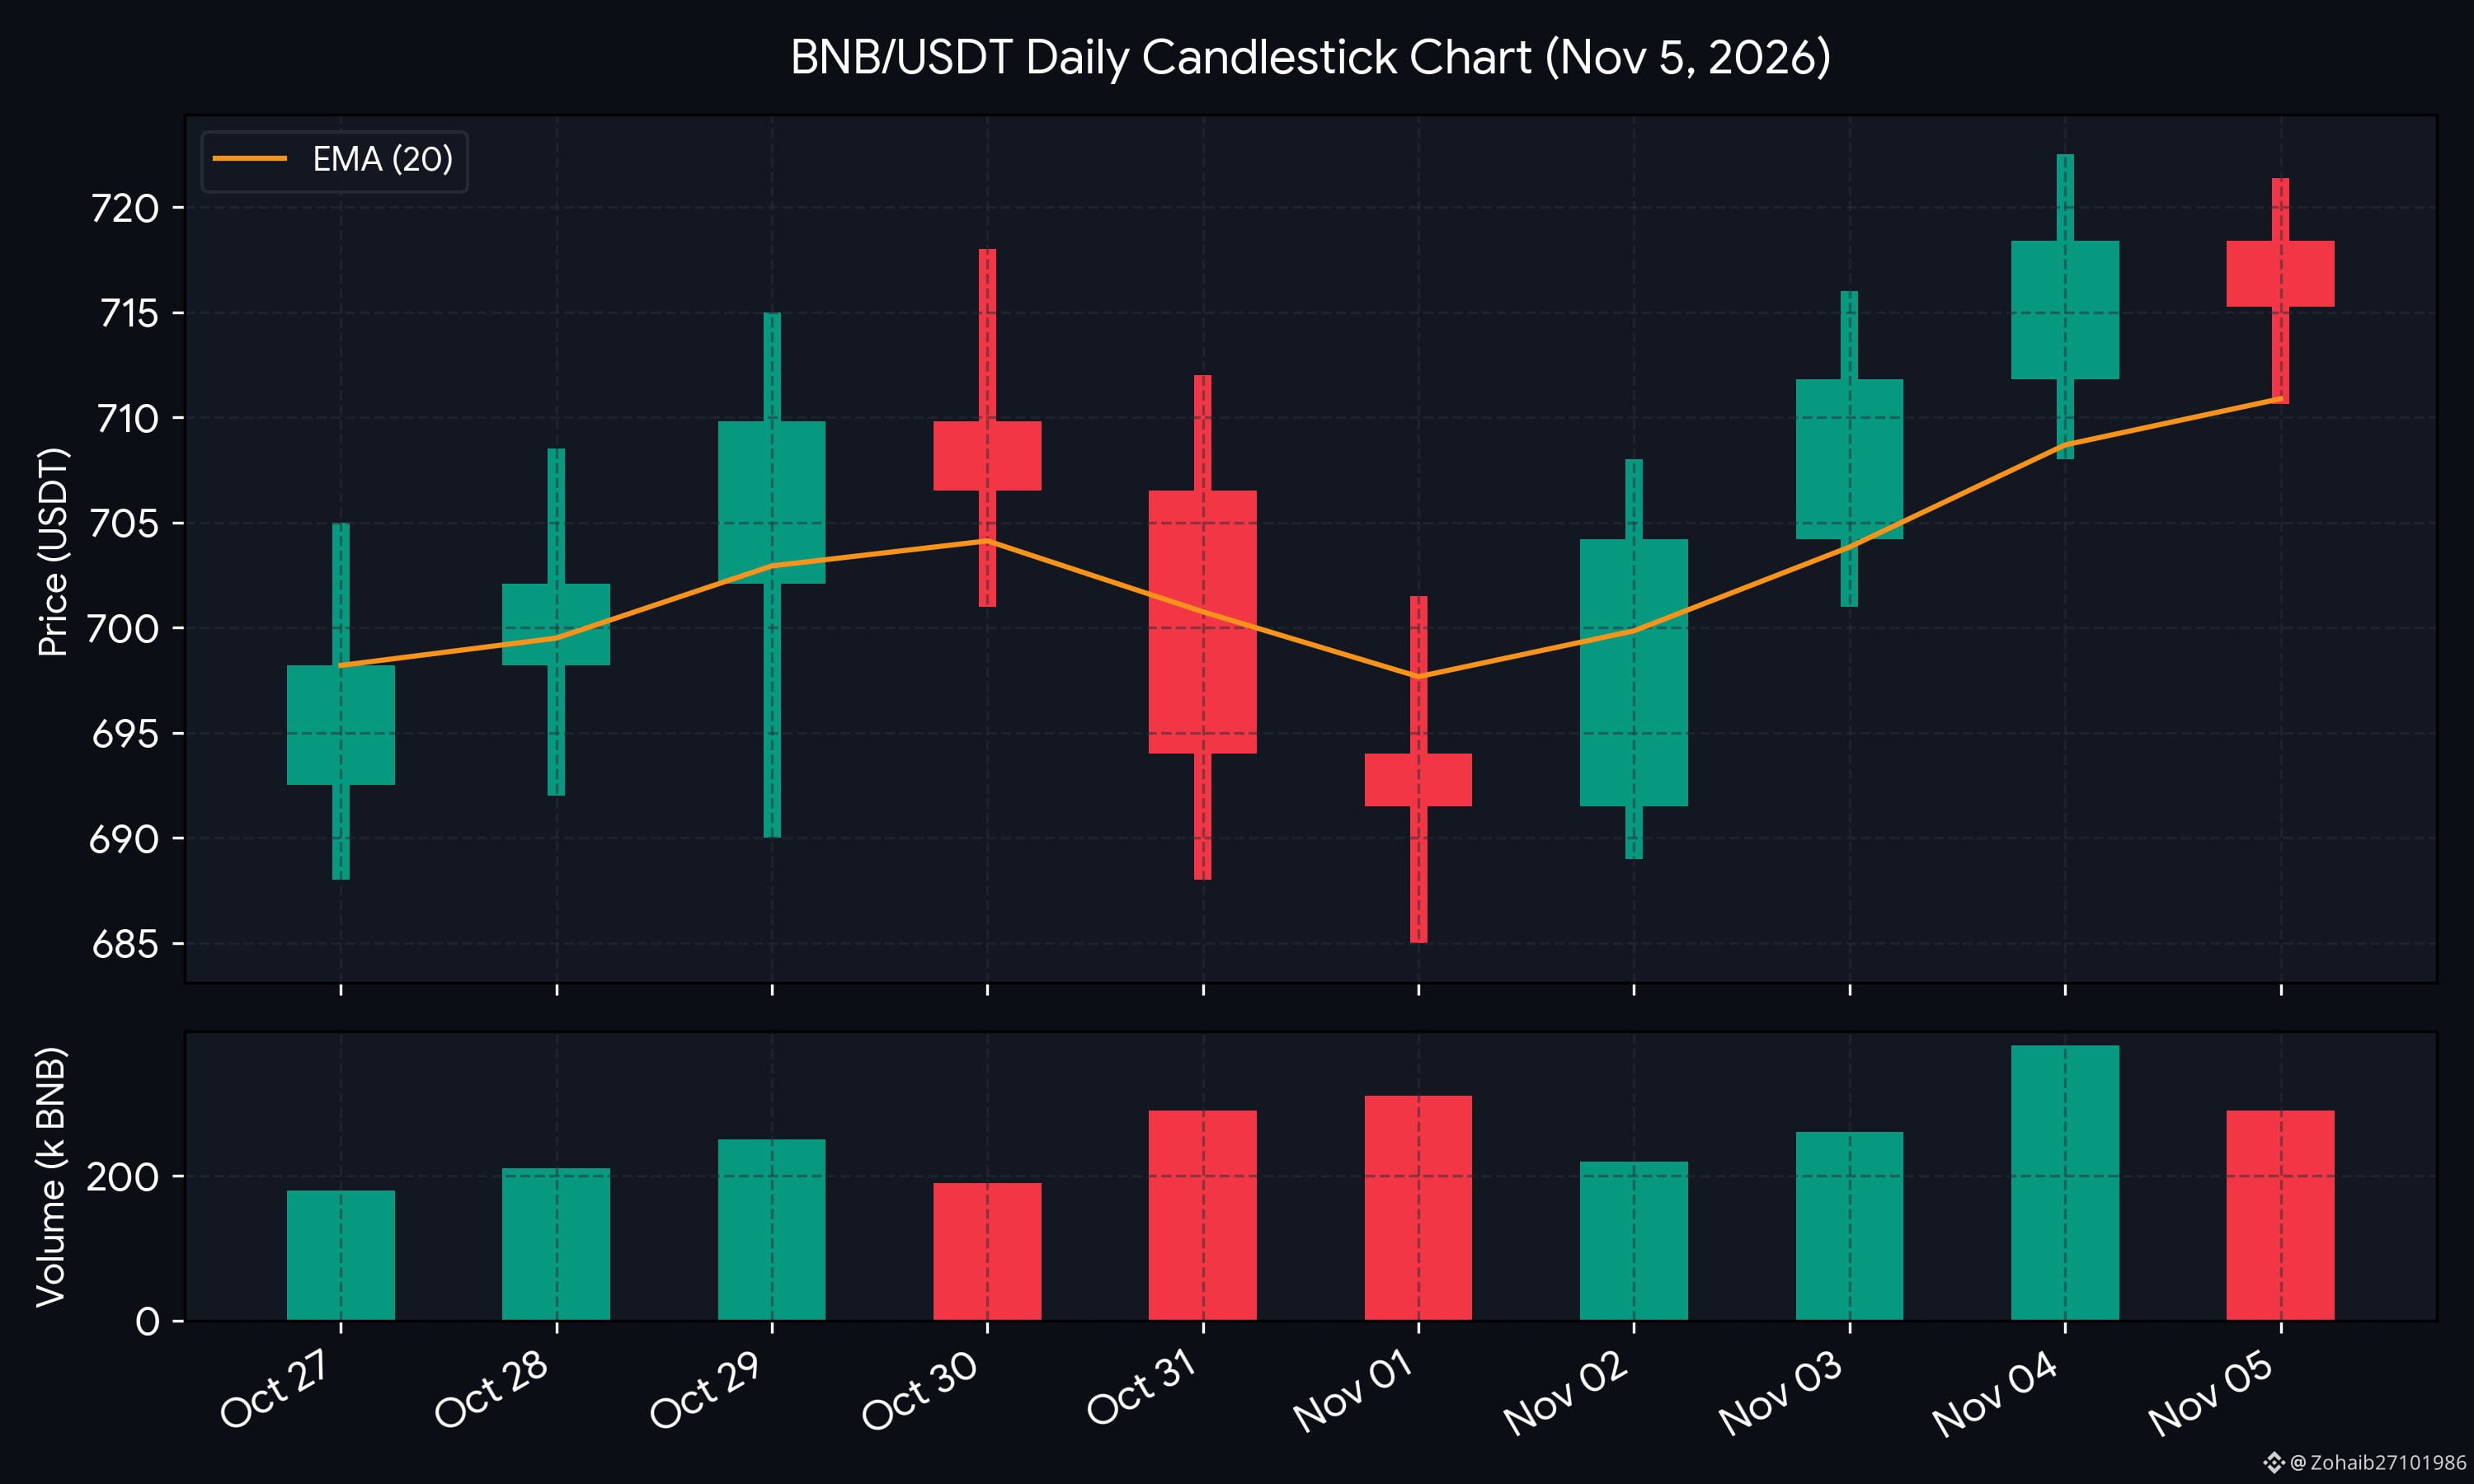
BNB is consolidating in a tight band around $714.00 – $718.00. Following the recent market recovery, BNB has held firm above the key $700.00 structural support, demonstrating steady buy-side demand on minor pullbacks.
📈 BNB Daily Candlestick Chart
🔍 Technical Breakdown
Price Action & Support/Resistance:
Current Spot Price: ~$715.27 USDT (~PKR 197,654)
24h High / Low: $721.37 / $710.63
Immediate Resistance: $721.50 – $724.00 (Breakout trigger level)
Major Resistance Zone: $734.00 – $740.00
Immediate Support: $710.00 – $711.50
Key Base Support: $688.00 – $691.00
Moving Averages & Indicators:
EMA 20 (Orange line): Currently trending upward at ~$711.00, serving as dynamic support for intraday dips.
RSI (14): Hovering around 56–58, indicating moderate bullish momentum without entering overbought conditions.
#BNB_Market_Update #USDT🔥🔥🔥
BNB is consolidating in a tight band around $714.00 – $718.00. Following the recent market recovery, BNB has held firm above the key $700.00 structural support, demonstrating steady buy-side demand on minor pullbacks.
📈 BNB Daily Candlestick Chart
🔍 Technical Breakdown
Price Action & Support/Resistance:
Current Spot Price: ~$715.27 USDT (~PKR 197,654)
24h High / Low: $721.37 / $710.63
Immediate Resistance: $721.50 – $724.00 (Breakout trigger level)
Major Resistance Zone: $734.00 – $740.00
Immediate Support: $710.00 – $711.50
Key Base Support: $688.00 – $691.00
Moving Averages & Indicators:
EMA 20 (Orange line): Currently trending upward at ~$711.00, serving as dynamic support for intraday dips.
RSI (14): Hovering around 56–58, indicating moderate bullish momentum without entering overbought conditions.
#BNB_Market_Update #USDT🔥🔥🔥