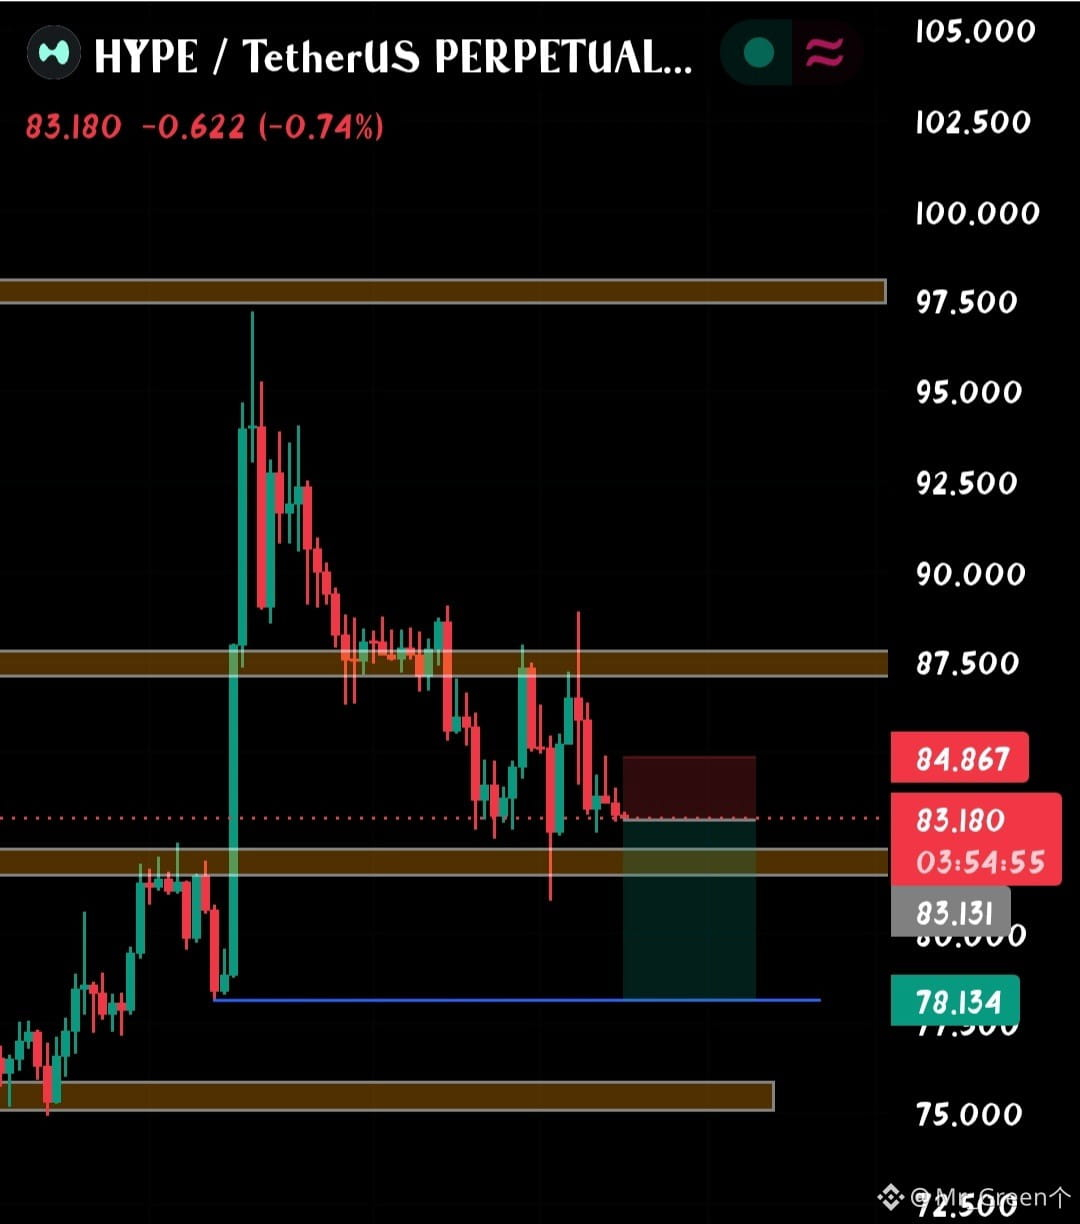

📊 $HYPE — PRICE RESPECTS THESE ZONES. WHERE IS IT HEADING NEXT? 👀
One thing I've noticed while studying HYPE is how consistently price reacts whenever it reaches the marked zones. These aren't random horizontal lines. I've identified them using a combination of historical support/resistance reactions and Fixed Range Volume Profile.
Let's break down the current structure.
After reaching the $94–$95 region, HYPE started forming lower highs and lower lows. Sellers gradually took control, and price is now trading around $83.18.
The $87.50–$88.00 zone has repeatedly acted as resistance. Every rejection from this area has created another downward move.
Now price is approaching the next important support zone around $81.50–$82.00.
🎯 WHAT I'M WATCHING NEXT:
🔴 Bearish scenario: If price breaks below the $81.50–$82.00 support zone and confirms the breakdown with a retest, we could see a move towards $78.13, followed by the stronger $75–$76 demand zone.
🟢 Bullish scenario: If buyers defend the current support and reclaim $87.50–$88.00, the bearish structure could weaken. A recovery towards the $97.50–$98.00 supply zone may then become possible.
MY STRATEGY:
I'm leaning bearish while price remains below $87.50–$88.00, but I don't want to ignore the nearby support.
My marked SHORT setup has:
Entry reference: $83.13
Stop-Loss: $84.87
Target: $78.13
I'll watch how price reacts around the $82 area before deciding whether to continue holding the bearish position.
The interesting thing about volume-profile trading is that it helps identify where significant trading activity has occurred, while support and resistance show where price has repeatedly reacted.
Don't predict the zone. Watch the reaction!
Let's see which side wins this battle. 👀
Follow for more technical and volume-profile-based analysis! 👇
Coming up next $NEAR and $SUI analysis...
One thing I've noticed while studying HYPE is how consistently price reacts whenever it reaches the marked zones. These aren't random horizontal lines. I've identified them using a combination of historical support/resistance reactions and Fixed Range Volume Profile.
Let's break down the current structure.
After reaching the $94–$95 region, HYPE started forming lower highs and lower lows. Sellers gradually took control, and price is now trading around $83.18.
The $87.50–$88.00 zone has repeatedly acted as resistance. Every rejection from this area has created another downward move.
Now price is approaching the next important support zone around $81.50–$82.00.
🎯 WHAT I'M WATCHING NEXT:
🔴 Bearish scenario: If price breaks below the $81.50–$82.00 support zone and confirms the breakdown with a retest, we could see a move towards $78.13, followed by the stronger $75–$76 demand zone.
🟢 Bullish scenario: If buyers defend the current support and reclaim $87.50–$88.00, the bearish structure could weaken. A recovery towards the $97.50–$98.00 supply zone may then become possible.
MY STRATEGY:
I'm leaning bearish while price remains below $87.50–$88.00, but I don't want to ignore the nearby support.
My marked SHORT setup has:
Entry reference: $83.13
Stop-Loss: $84.87
Target: $78.13
I'll watch how price reacts around the $82 area before deciding whether to continue holding the bearish position.
The interesting thing about volume-profile trading is that it helps identify where significant trading activity has occurred, while support and resistance show where price has repeatedly reacted.
Don't predict the zone. Watch the reaction!
Let's see which side wins this battle. 👀
Follow for more technical and volume-profile-based analysis! 👇
Coming up next $NEAR and $SUI analysis...