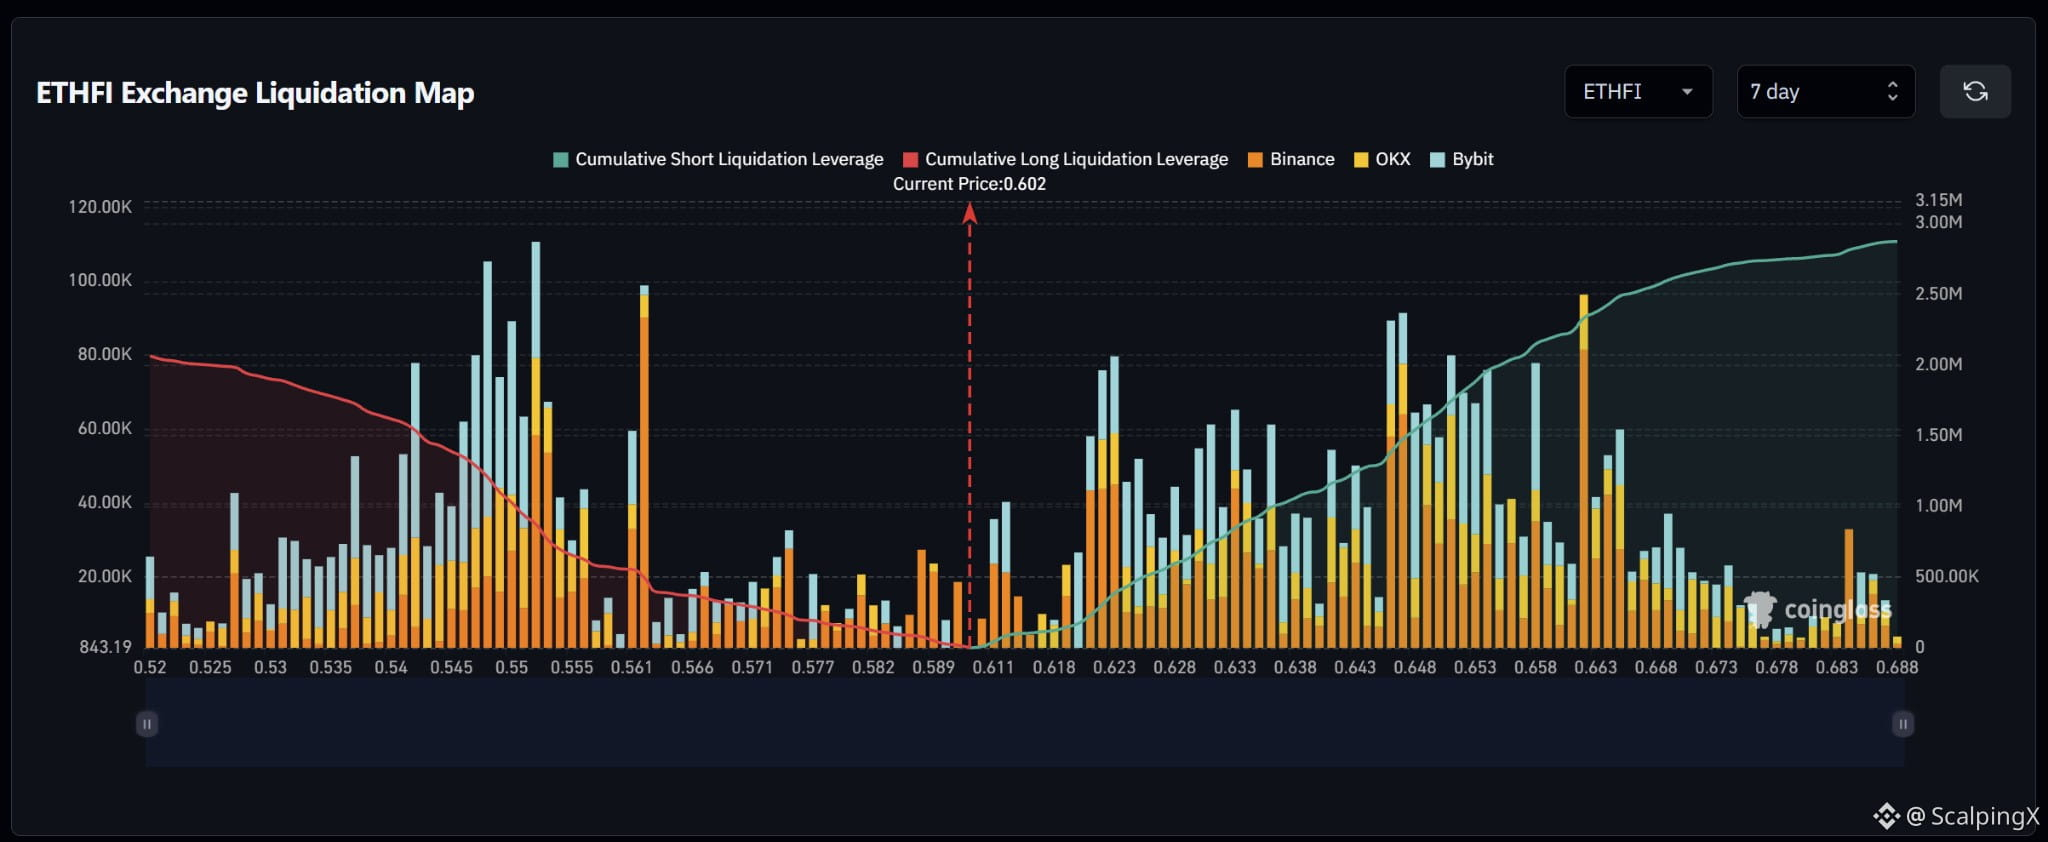
$ETHFI – Liquidation Map (7 days) – Index ~0.602
🧭 The preferred scenario is an upside short-liquidation sweep, starting at 0.610–0.612. Estimated cumulative short exposure approaches $2.9M, versus roughly $2M on the long side within the displayed range.
🔺 If price clears and holds above 0.612, attention shifts to 0.621–0.625. Bars around 0.614–0.618 are relatively small, while the more prominent cluster near 0.622–0.623 could amplify volatility as price approaches.
🎯 Holding above 0.625 after the sweep brings 0.629–0.637 and 0.646–0.655 into focus. A large isolated bar sits near 0.662; beyond 0.666, clusters generally become smaller and more scattered.
⚖️ Losing 0.600 without reclaiming it weakens the upside scenario, shifting attention to 0.588–0.591, then 0.573–0.576. Stronger long clusters sit at 0.545–0.554 and near 0.562. A sweep of 0.610–0.612 followed by a quick drop below 0.610 would increase the risk of a failed upside move.
#LiquidationMap
🧭 The preferred scenario is an upside short-liquidation sweep, starting at 0.610–0.612. Estimated cumulative short exposure approaches $2.9M, versus roughly $2M on the long side within the displayed range.
🔺 If price clears and holds above 0.612, attention shifts to 0.621–0.625. Bars around 0.614–0.618 are relatively small, while the more prominent cluster near 0.622–0.623 could amplify volatility as price approaches.
🎯 Holding above 0.625 after the sweep brings 0.629–0.637 and 0.646–0.655 into focus. A large isolated bar sits near 0.662; beyond 0.666, clusters generally become smaller and more scattered.
⚖️ Losing 0.600 without reclaiming it weakens the upside scenario, shifting attention to 0.588–0.591, then 0.573–0.576. Stronger long clusters sit at 0.545–0.554 and near 0.562. A sweep of 0.610–0.612 followed by a quick drop below 0.610 would increase the risk of a failed upside move.
#LiquidationMap