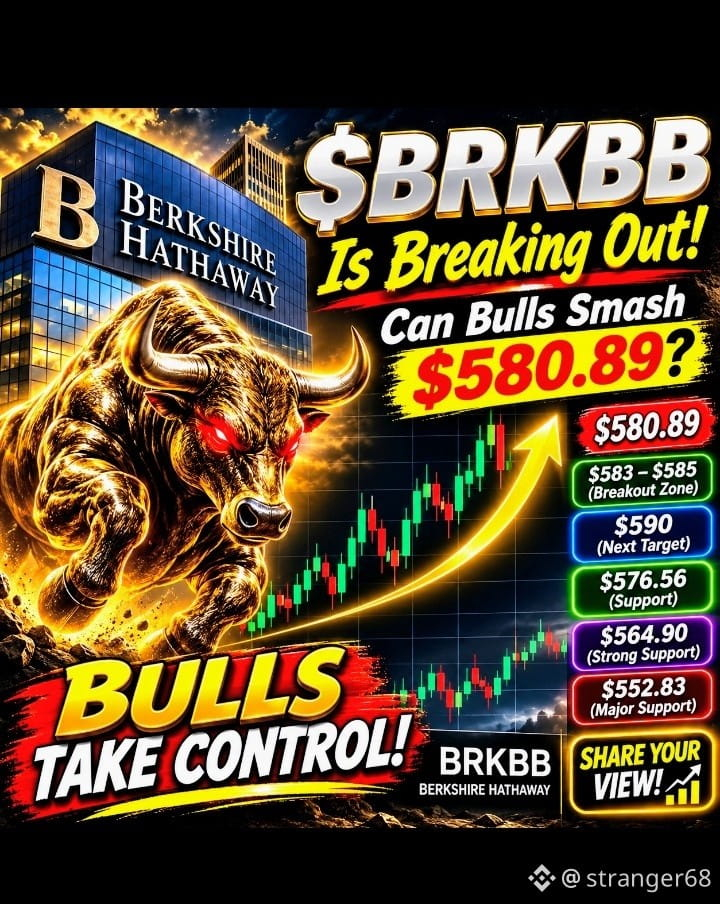
🚀 $BRKBB Is Breaking Out! Can Bulls Smash $580.89 and Push Toward $590? 💎
🔥 $BRKBB /USDT is trading around $577.02, up 3.57% in 24H, following a powerful surge from $555.77. Buyers are pushing toward a fresh resistance battle! ⚡
⏱️ 1H Chart: Price is holding above MA(7) $576.56, MA(25) $564.90 and MA(99) $552.83. Short-term momentum remains bullish. 📈
📊 4H Chart: Strong breakout structure! Price is above MA(7) $566.11 and MA(25) $553.76. Buyers remain in control after breaking out of the $542–$553 consolidation zone. 🔥
🌍 1D Chart: Price is trading above MA(7) $552.93, showing a strong upward move. Daily history is limited, so confirmation from additional candles is important. 💪
🎯 THE BIG PRICE BATTLE:
- Immediate resistance: $580.89
- Breakout zone: $583–$585
- Next upside target: $590
- First support: $576.56
- Strong support: $564.90
- Major support: $552.83
⚠️ RISK CHECK: A rejection around $580.89 could trigger profit-taking. Watch for a strong close above resistance with volume before confirming another breakout.
🔥 THE $580.89 LEVEL IS THE KEY! Can Berkshire bulls break higher and take BRKBB toward $590, or will sellers defend resistance? Share your prediction! 🚀
#BRKBB #BerkshireHathaway #StockMarket
#BinanceIncidentReport #USOctoberNFP-AreRateCutsStillPossible #USMidterms-WhatAreMarketsExpecting? #AMDBeatsExpectations-AINarrativeContinues
🔥 $BRKBB /USDT is trading around $577.02, up 3.57% in 24H, following a powerful surge from $555.77. Buyers are pushing toward a fresh resistance battle! ⚡
⏱️ 1H Chart: Price is holding above MA(7) $576.56, MA(25) $564.90 and MA(99) $552.83. Short-term momentum remains bullish. 📈
📊 4H Chart: Strong breakout structure! Price is above MA(7) $566.11 and MA(25) $553.76. Buyers remain in control after breaking out of the $542–$553 consolidation zone. 🔥
🌍 1D Chart: Price is trading above MA(7) $552.93, showing a strong upward move. Daily history is limited, so confirmation from additional candles is important. 💪
🎯 THE BIG PRICE BATTLE:
- Immediate resistance: $580.89
- Breakout zone: $583–$585
- Next upside target: $590
- First support: $576.56
- Strong support: $564.90
- Major support: $552.83
⚠️ RISK CHECK: A rejection around $580.89 could trigger profit-taking. Watch for a strong close above resistance with volume before confirming another breakout.
🔥 THE $580.89 LEVEL IS THE KEY! Can Berkshire bulls break higher and take BRKBB toward $590, or will sellers defend resistance? Share your prediction! 🚀
#BRKBB #BerkshireHathaway #StockMarket
#BinanceIncidentReport #USOctoberNFP-AreRateCutsStillPossible #USMidterms-WhatAreMarketsExpecting? #AMDBeatsExpectations-AINarrativeContinues