

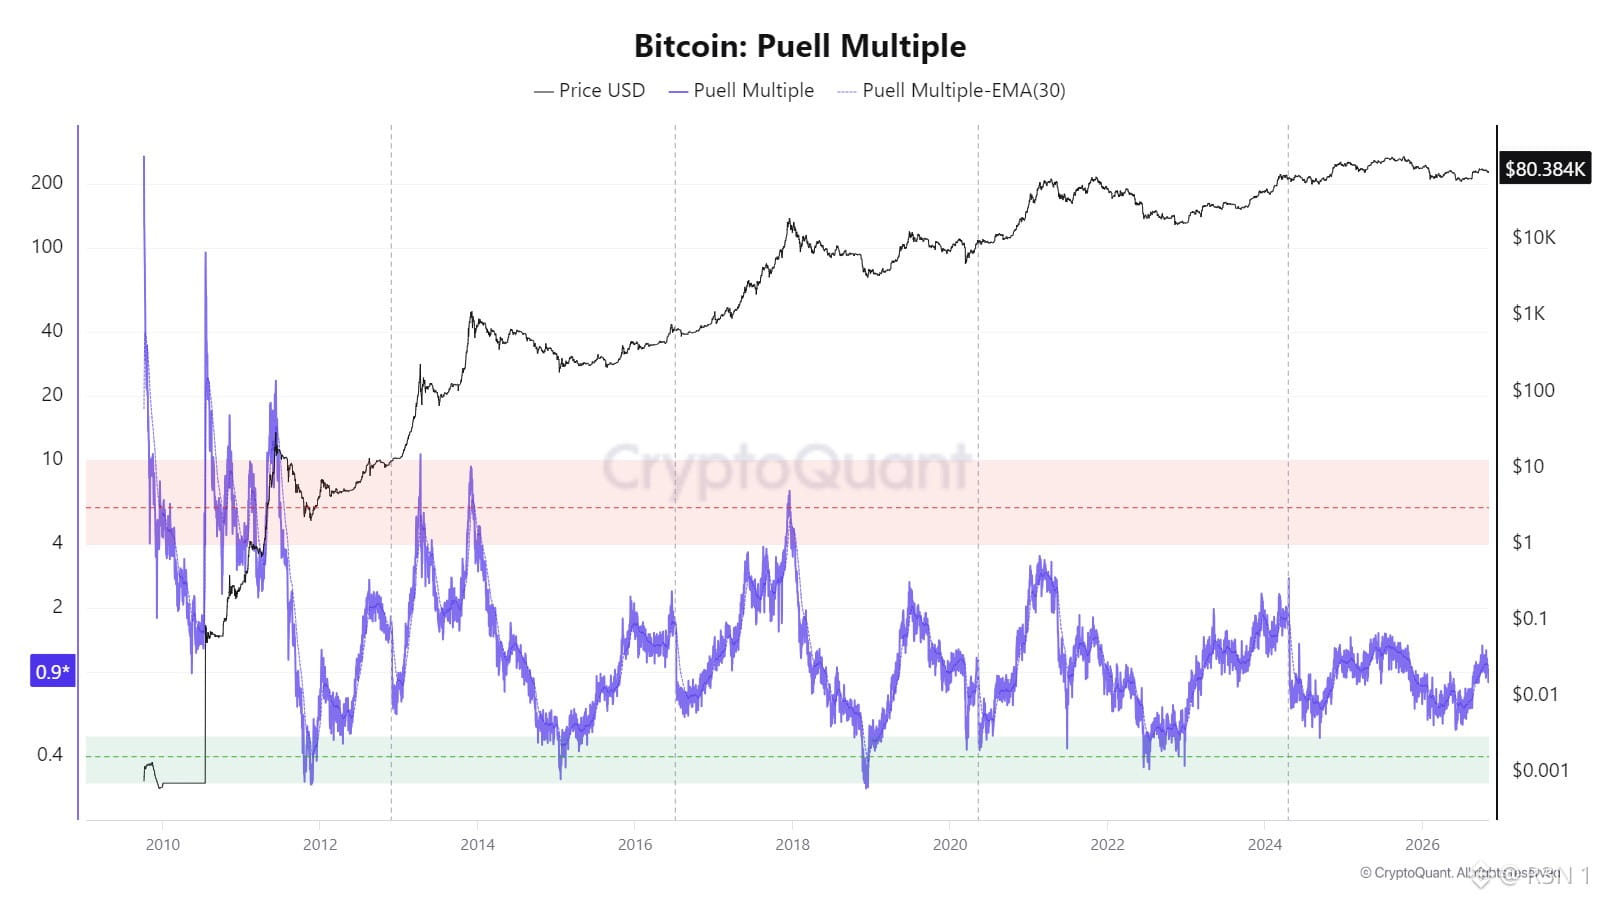
Bitcoin’s Puell Multiple sits near 0.9 with BTC around $80.4K. The metric compares daily miner revenue to its one-year average, so 0.9 means miners are earning a little less than their typical year. That’s not great, but it isn’t distress. The chart shows where stress has shown up before. The green zone, roughly below 0.5, lines up with the deep lows of 2011-12, 2015, late 2018, and 2022. The red zone above 4 matches old euphoric peaks. Today’s reading sits in the dull middle, far from both. That matters because miners are natural sellers. When revenue gets squeezed, they sell coins to cover costs, which can amplify a low. At 0.9, I don’t see that pressure. October’s $12.5B liquidation wave points more toward trader leverage than miner stress. This also connects to the midterm bottom debate. Past lows came with a deeper squeeze in this metric than we see now. Traders looking for the typical post-election bottom may want to ask whether the miner side has shown the same pain yet. It’s a question, not a prediction. The psychology is familiar. Every dip gets called “capitulation,” but this measure says that level of stress hasn’t arrived. The risk is a further drop that pushes miner revenue toward the green zone. The bullish possibility is that steady miner economics means less supply pressure hanging over the market. It’s one metric, though. It can’t see miners’ actual costs, and the 2024 halving changed how issuance looks in this data. A calm miner is a quiet signal. It says the stress is somewhere else. $BTC #BTC Price Analysis# #Meme Alpha#
Krypto-Nutzer weltweit auf Binance Square kennenlernen
⚡️ Bleib in Sachen Krypto stets am Puls.
💬 Die weltgrößte Kryptobörse vertraut darauf.
👍 Erhalte verlässliche Einblicke von verifizierten Creators.
E-Mail-Adresse/Telefonnummer