$BNB
(Binance Coin) – Latest Market Analysis
4 November 2026 | Cryptocurrency technical overview
BNB is the native cryptocurrency of the BNB Chain ecosystem and is closely associated with the Binance platform.
For trading, the key things to watch are the current price trend, support and resistance levels, trading volume, and Bitcoin's direction.BNB/USDT
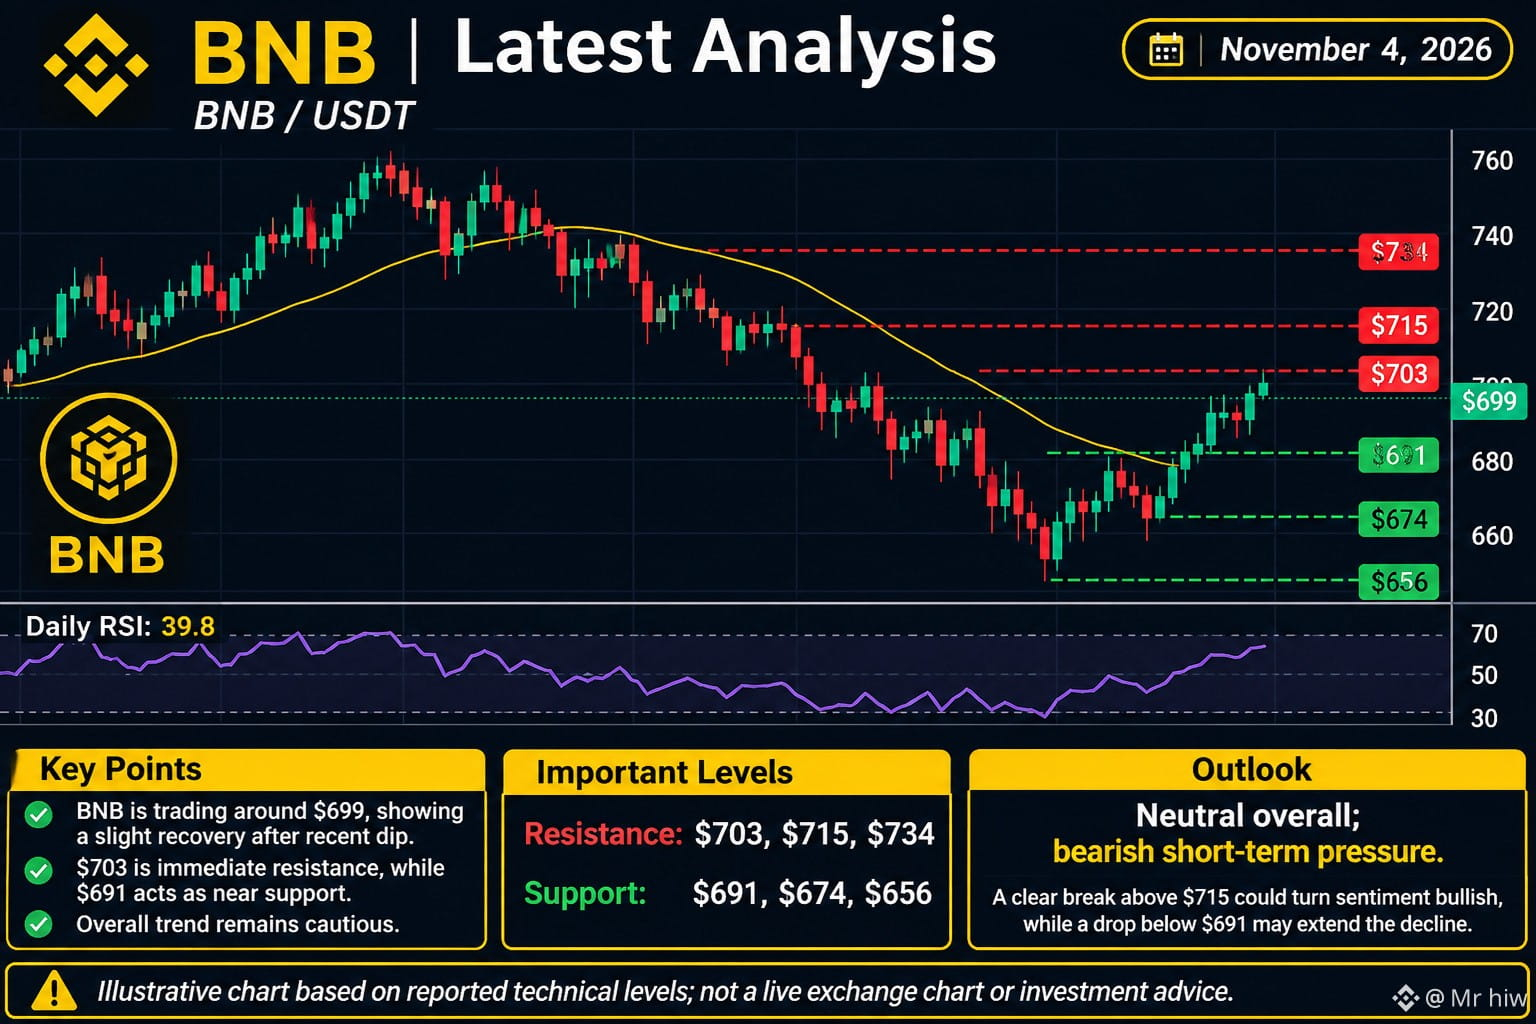
$699–703
Approximate live price range reported on November 4, 2026.
Technical indicator Latest reading
Daily RSI 39.8
Nearest support $691
Next support $674
Immediate resistance $703
Stronger resistance $715
Higher resistance $734Technical analysis
Short-term: Bearish pressure remains; BNB is struggling around $700.
Daily trend: Neutral to bearish, with RSI around 39.8.
Weekly trend: More constructive than the short-term trend.
Momentum: A recovery above $703–715 would improve the bullish outlook.
2. Support and resistance
Support 1: $691
Support 2: $674
Support 3: $656
Resistance 1: $703
Resistance 2: $715
Resistance 3: $734Possible trading scenarios
Scenario What to watch
Break and hold above $715; possible move toward $734
Break below $691; possible move toward $674
Consolidation between $691 and $715Final conclusion
BNB is showing some recovery, but the market has not yet confirmed a strong bullish reversal. Watch the $691 support and $715 resistance carefully.#USMidterms-WhatAreMarketsExpecting? #USOctoberNFP-AreRateCutsStillPossible #CircleQ3Revenue865M #AMDBeatsExpectations-AINarrativeContinues #BinanceIncidentReport
(Binance Coin) – Latest Market Analysis
4 November 2026 | Cryptocurrency technical overview
BNB is the native cryptocurrency of the BNB Chain ecosystem and is closely associated with the Binance platform.
For trading, the key things to watch are the current price trend, support and resistance levels, trading volume, and Bitcoin's direction.BNB/USDT
$699–703
Approximate live price range reported on November 4, 2026.
Technical indicator Latest reading
Daily RSI 39.8
Nearest support $691
Next support $674
Immediate resistance $703
Stronger resistance $715
Higher resistance $734Technical analysis
Short-term: Bearish pressure remains; BNB is struggling around $700.
Daily trend: Neutral to bearish, with RSI around 39.8.
Weekly trend: More constructive than the short-term trend.
Momentum: A recovery above $703–715 would improve the bullish outlook.
2. Support and resistance
Support 1: $691
Support 2: $674
Support 3: $656
Resistance 1: $703
Resistance 2: $715
Resistance 3: $734Possible trading scenarios
Scenario What to watch
Break and hold above $715; possible move toward $734
Break below $691; possible move toward $674
Consolidation between $691 and $715Final conclusion
BNB is showing some recovery, but the market has not yet confirmed a strong bullish reversal. Watch the $691 support and $715 resistance carefully.#USMidterms-WhatAreMarketsExpecting? #USOctoberNFP-AreRateCutsStillPossible #CircleQ3Revenue865M #AMDBeatsExpectations-AINarrativeContinues #BinanceIncidentReport