
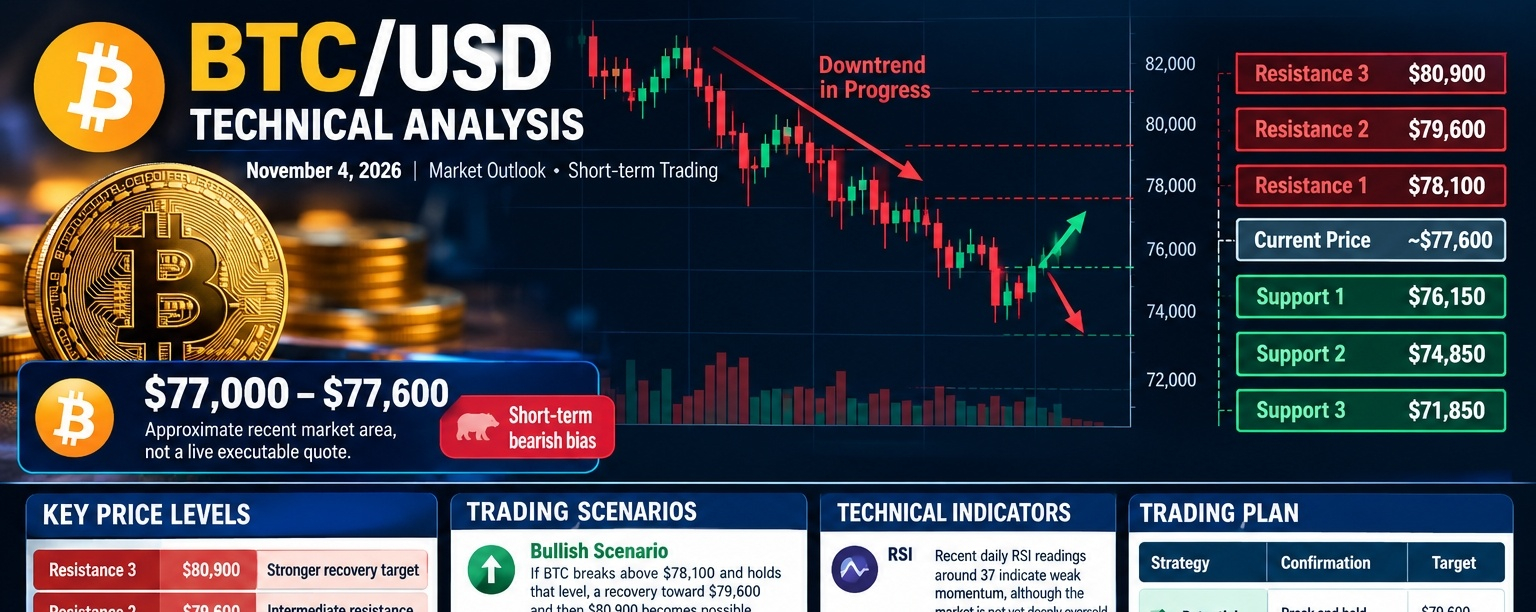

$BTC /USD Technical Analysis — November 4, 2026

Market outlook · Short-term trading · USD
$BTC Bitcoin is showing a short-term bearish trend with the possibility of a relief bounce. Recent market reports show BTC under pressure after falling toward the $76,000 area, while technical indicators suggest that buyers need to reclaim nearby resistance levels before a stronger recovery can develop. Admirals +1

### $77,000–$77,600
Approximate recent market area, not a live executable quote
Short-term bearish bias
### 1\. Key price levels
The following levels are based on technical readings published around November 3–4, 2026. Prices can change rapidly. Borearis +1
| Level | BTC price (USD) | Significance |
| ----------------- | --------------- | ------------------------ |
| Resistance 3 | $80,900 | Stronger recovery target |
| Resistance 2 | $79,600 | Intermediate resistance |
| Resistance 1 | $78,100 | First bullish hurdle |
| Current reference | ~$77,600 | Recent market area |
| Support 1 | $76,150 | Important support |
| Support 2 | $74,850 | Lower support zone |
| Support 3 | $71,850 | Deeper downside area |
### 2\. Trading scenarios
Bullish scenario
If $BTC breaks above $78,100 and holds that level, a recovery toward $79,600 and then $80,900 becomes possible. Strong buying volume would improve the bullish case.
Bearish scenario
If BTC breaks below $76,150 and fails to recover, the next downside levels to watch are $74,850 and potentially $71,850.
Sideways scenario
If Bitcoin remains between roughly $76,150 and $78,100, expect choppy price action until a decisive breakout or breakdown occurs.
### 3\. Technical indicators
* RSI: Recent daily RSI readings around 37 indicate weak momentum, although the market is not yet deeply oversold.
* Trend: Short-term momentum remains weak, with the daily chart showing bearish pressure.
* Resistance: Buyers need to reclaim $78,100 to strengthen the recovery outlook.
* Support: The $76,150 region is an important level to monitor for a possible bounce. COINOTAG +1
### 4\. Trading plan
| Strategy | Confirmation | Target |
| --------------- | ----------------------------------- | --------------------- |
| Potential long | Break and hold above $78,100 | $79,600–$80,900 |
| Potential short | Breakdown below $76,150 | $74,850–$71,850 |
| No-trade zone | Price fluctuates between key levels | Wait for confirmation |
These are conditional scenarios, not guaranteed outcomes. Consider a stop-loss, position sizing and the risk of sudden volatility before entering a trade.
### Final verdict
BTC/USD outlook: Cautiously bearish in the short term. Bitcoin needs to recover above $78,100 to improve its immediate outlook. A confirmed break below $76,150 would increase downside risk toward $74,850.
My preference is to wait for a confirmed breakout or breakdown instead of chasing price in the middle of the range. This is tec
hnical analysis, not a guarantee or personalized financial advice.
#BTC走势分析 #BTCUSDT #bitcoin #viralmypost #TrendingPredictions