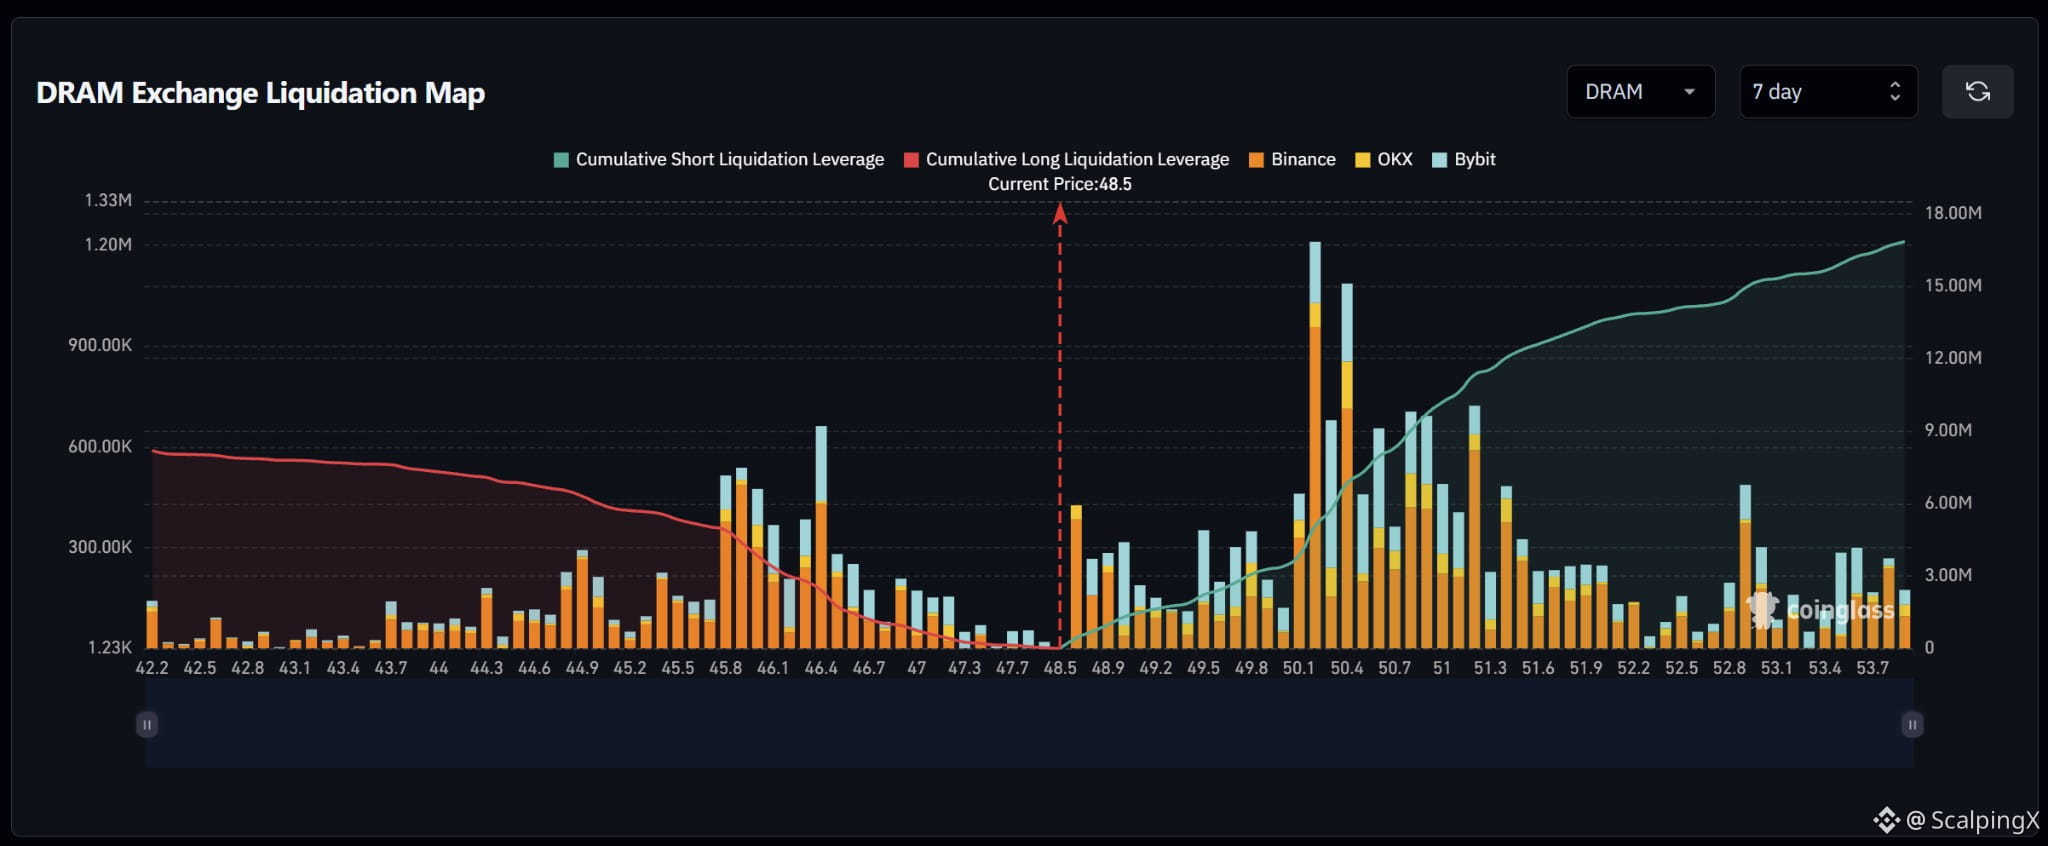
$DRAM – Liquidation Map (7 days) – Index ~48.5
🧭 The preferred scenario is an upside short sweep, starting at 48.6–49.0. Short clusters sit close to price, while nearby long exposure below is relatively sparse. Estimated cumulative short liquidation exposure is roughly $17 million across the displayed range, nearly twice the long side.
🔺 A break and hold above 49.0 after the initial sweep shifts attention to 49.5–49.9. The reaction there will help assess whether price can reach the larger short band above.
🎯 Holding above 49.9 brings the dense 50.1–51.4 band into focus. Bars near 50.2 and 50.4 are the largest on the map and could amplify an advance as shorts are liquidated. Above 51.6, bars become noticeably smaller, apart from an isolated cluster near 53.0.
⚖️ Losing 48.3 without a reclaim would weaken the upside scenario and shift attention to 47.7–47.9, then 46.8–47.3. A stronger long cluster sits at 45.8–46.5. Avoid chasing a sweep of 50.1–50.4 that quickly reverses below 49.9.
#LiquidationMap
🧭 The preferred scenario is an upside short sweep, starting at 48.6–49.0. Short clusters sit close to price, while nearby long exposure below is relatively sparse. Estimated cumulative short liquidation exposure is roughly $17 million across the displayed range, nearly twice the long side.
🔺 A break and hold above 49.0 after the initial sweep shifts attention to 49.5–49.9. The reaction there will help assess whether price can reach the larger short band above.
🎯 Holding above 49.9 brings the dense 50.1–51.4 band into focus. Bars near 50.2 and 50.4 are the largest on the map and could amplify an advance as shorts are liquidated. Above 51.6, bars become noticeably smaller, apart from an isolated cluster near 53.0.
⚖️ Losing 48.3 without a reclaim would weaken the upside scenario and shift attention to 47.7–47.9, then 46.8–47.3. A stronger long cluster sits at 45.8–46.5. Avoid chasing a sweep of 50.1–50.4 that quickly reverses below 49.9.
#LiquidationMap