
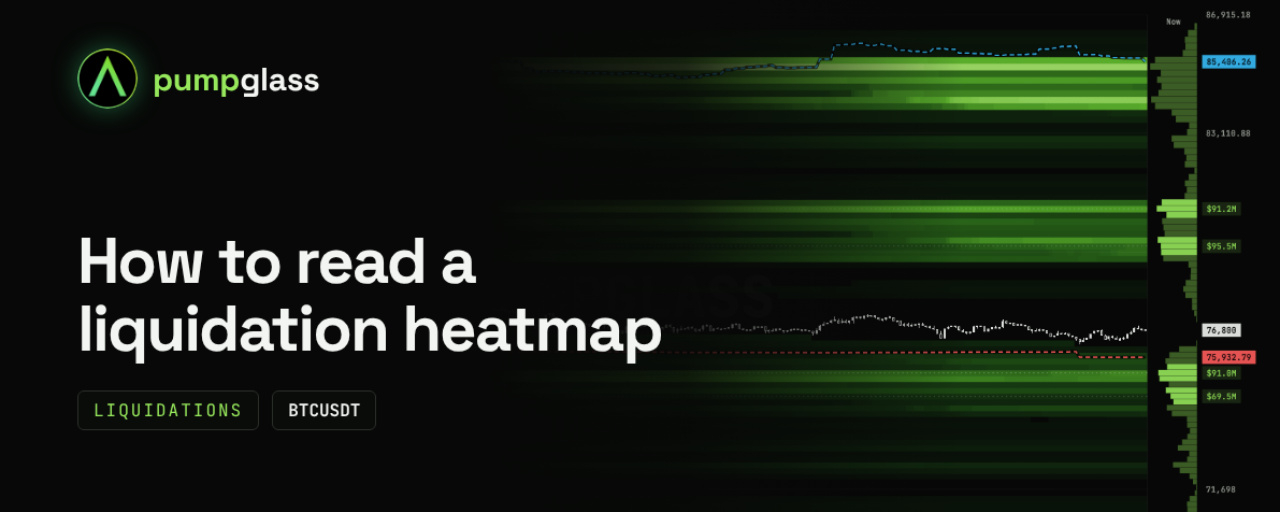
Most guides say liquidation levels pull the price like a magnet. The data says otherwise. Here is how to actually read the map.
Liquidations are fuel. A short liquidation is a forced market buy, a long liquidation is a forced market sell. When the price reaches a bright band, the move speeds up. The map does not say whether the price gets there.
Step by step on $BTC, November 3:
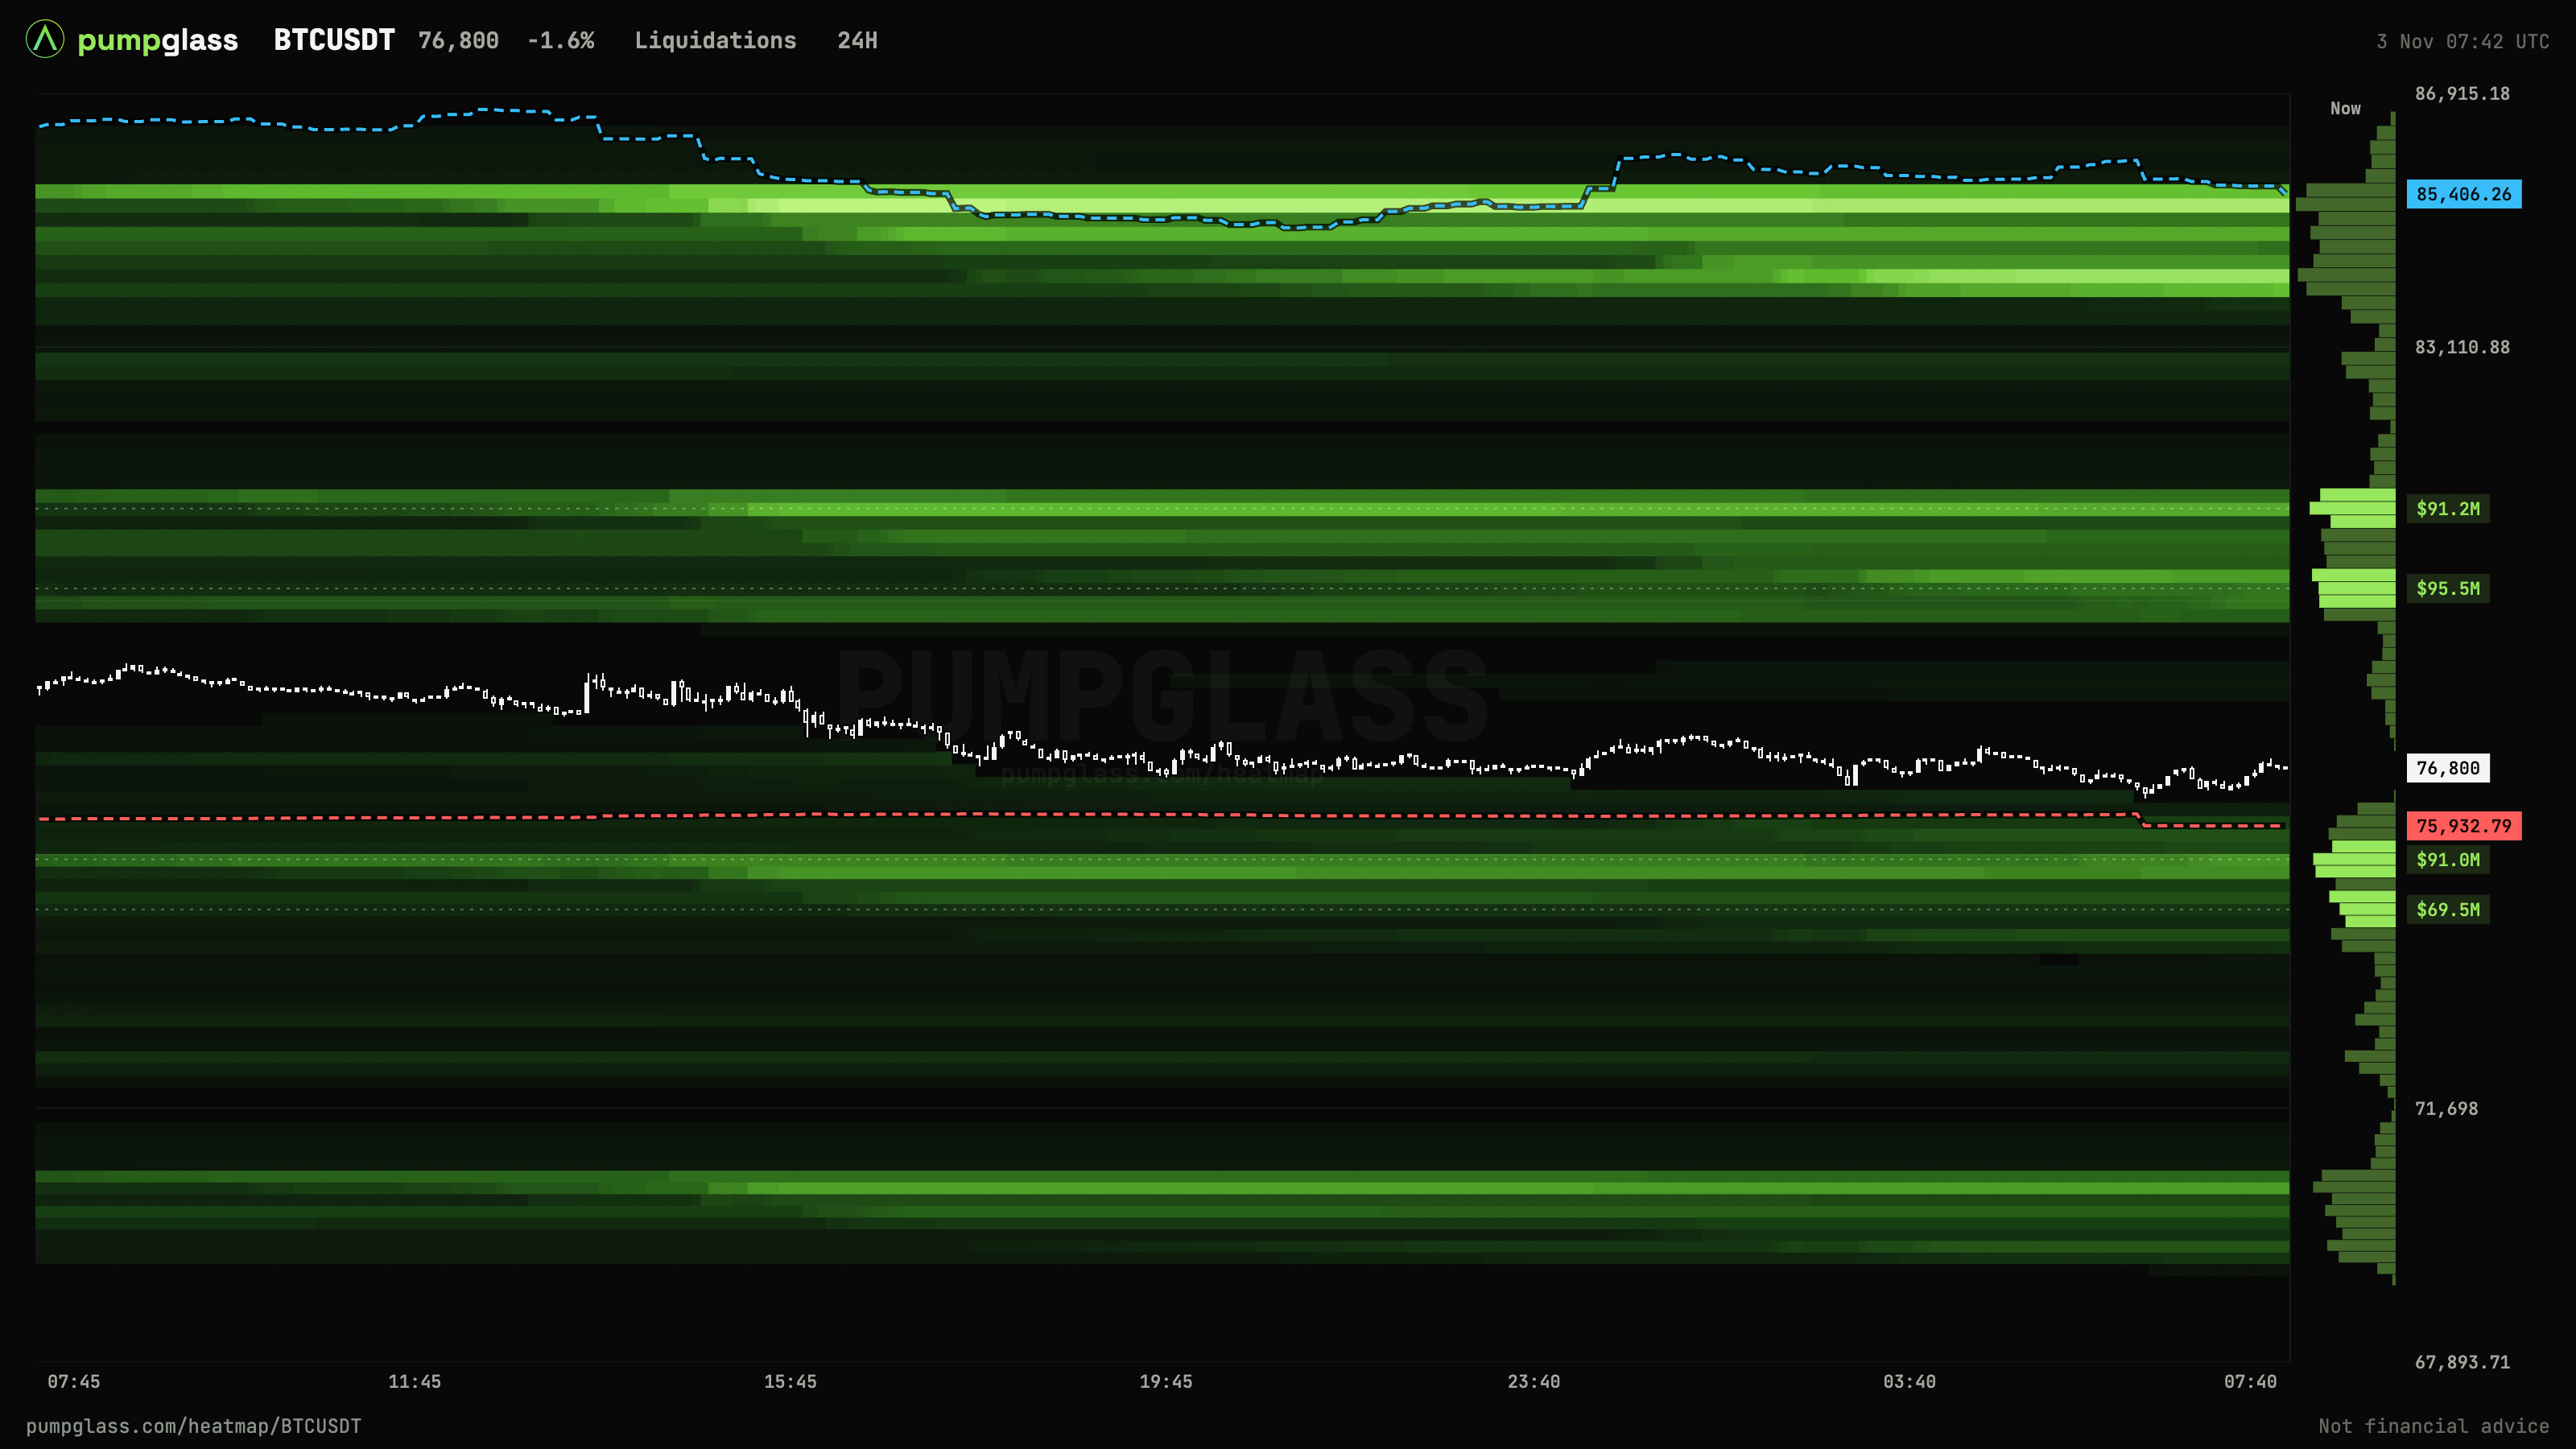
Above the price: $95.5M of shorts at $79,200 and $91.2M at $80,100
Below: $91.0M of longs at $75,300 and $69.5M at $74,700
Longs are closer: 2% away vs 3% for shorts
Whales' average long entry $75,932 sits right above the long cluster
The order book is different. Real limit orders do not speed the move up, they absorb it. But not every bright band there is a wall. Look at $HYPE:
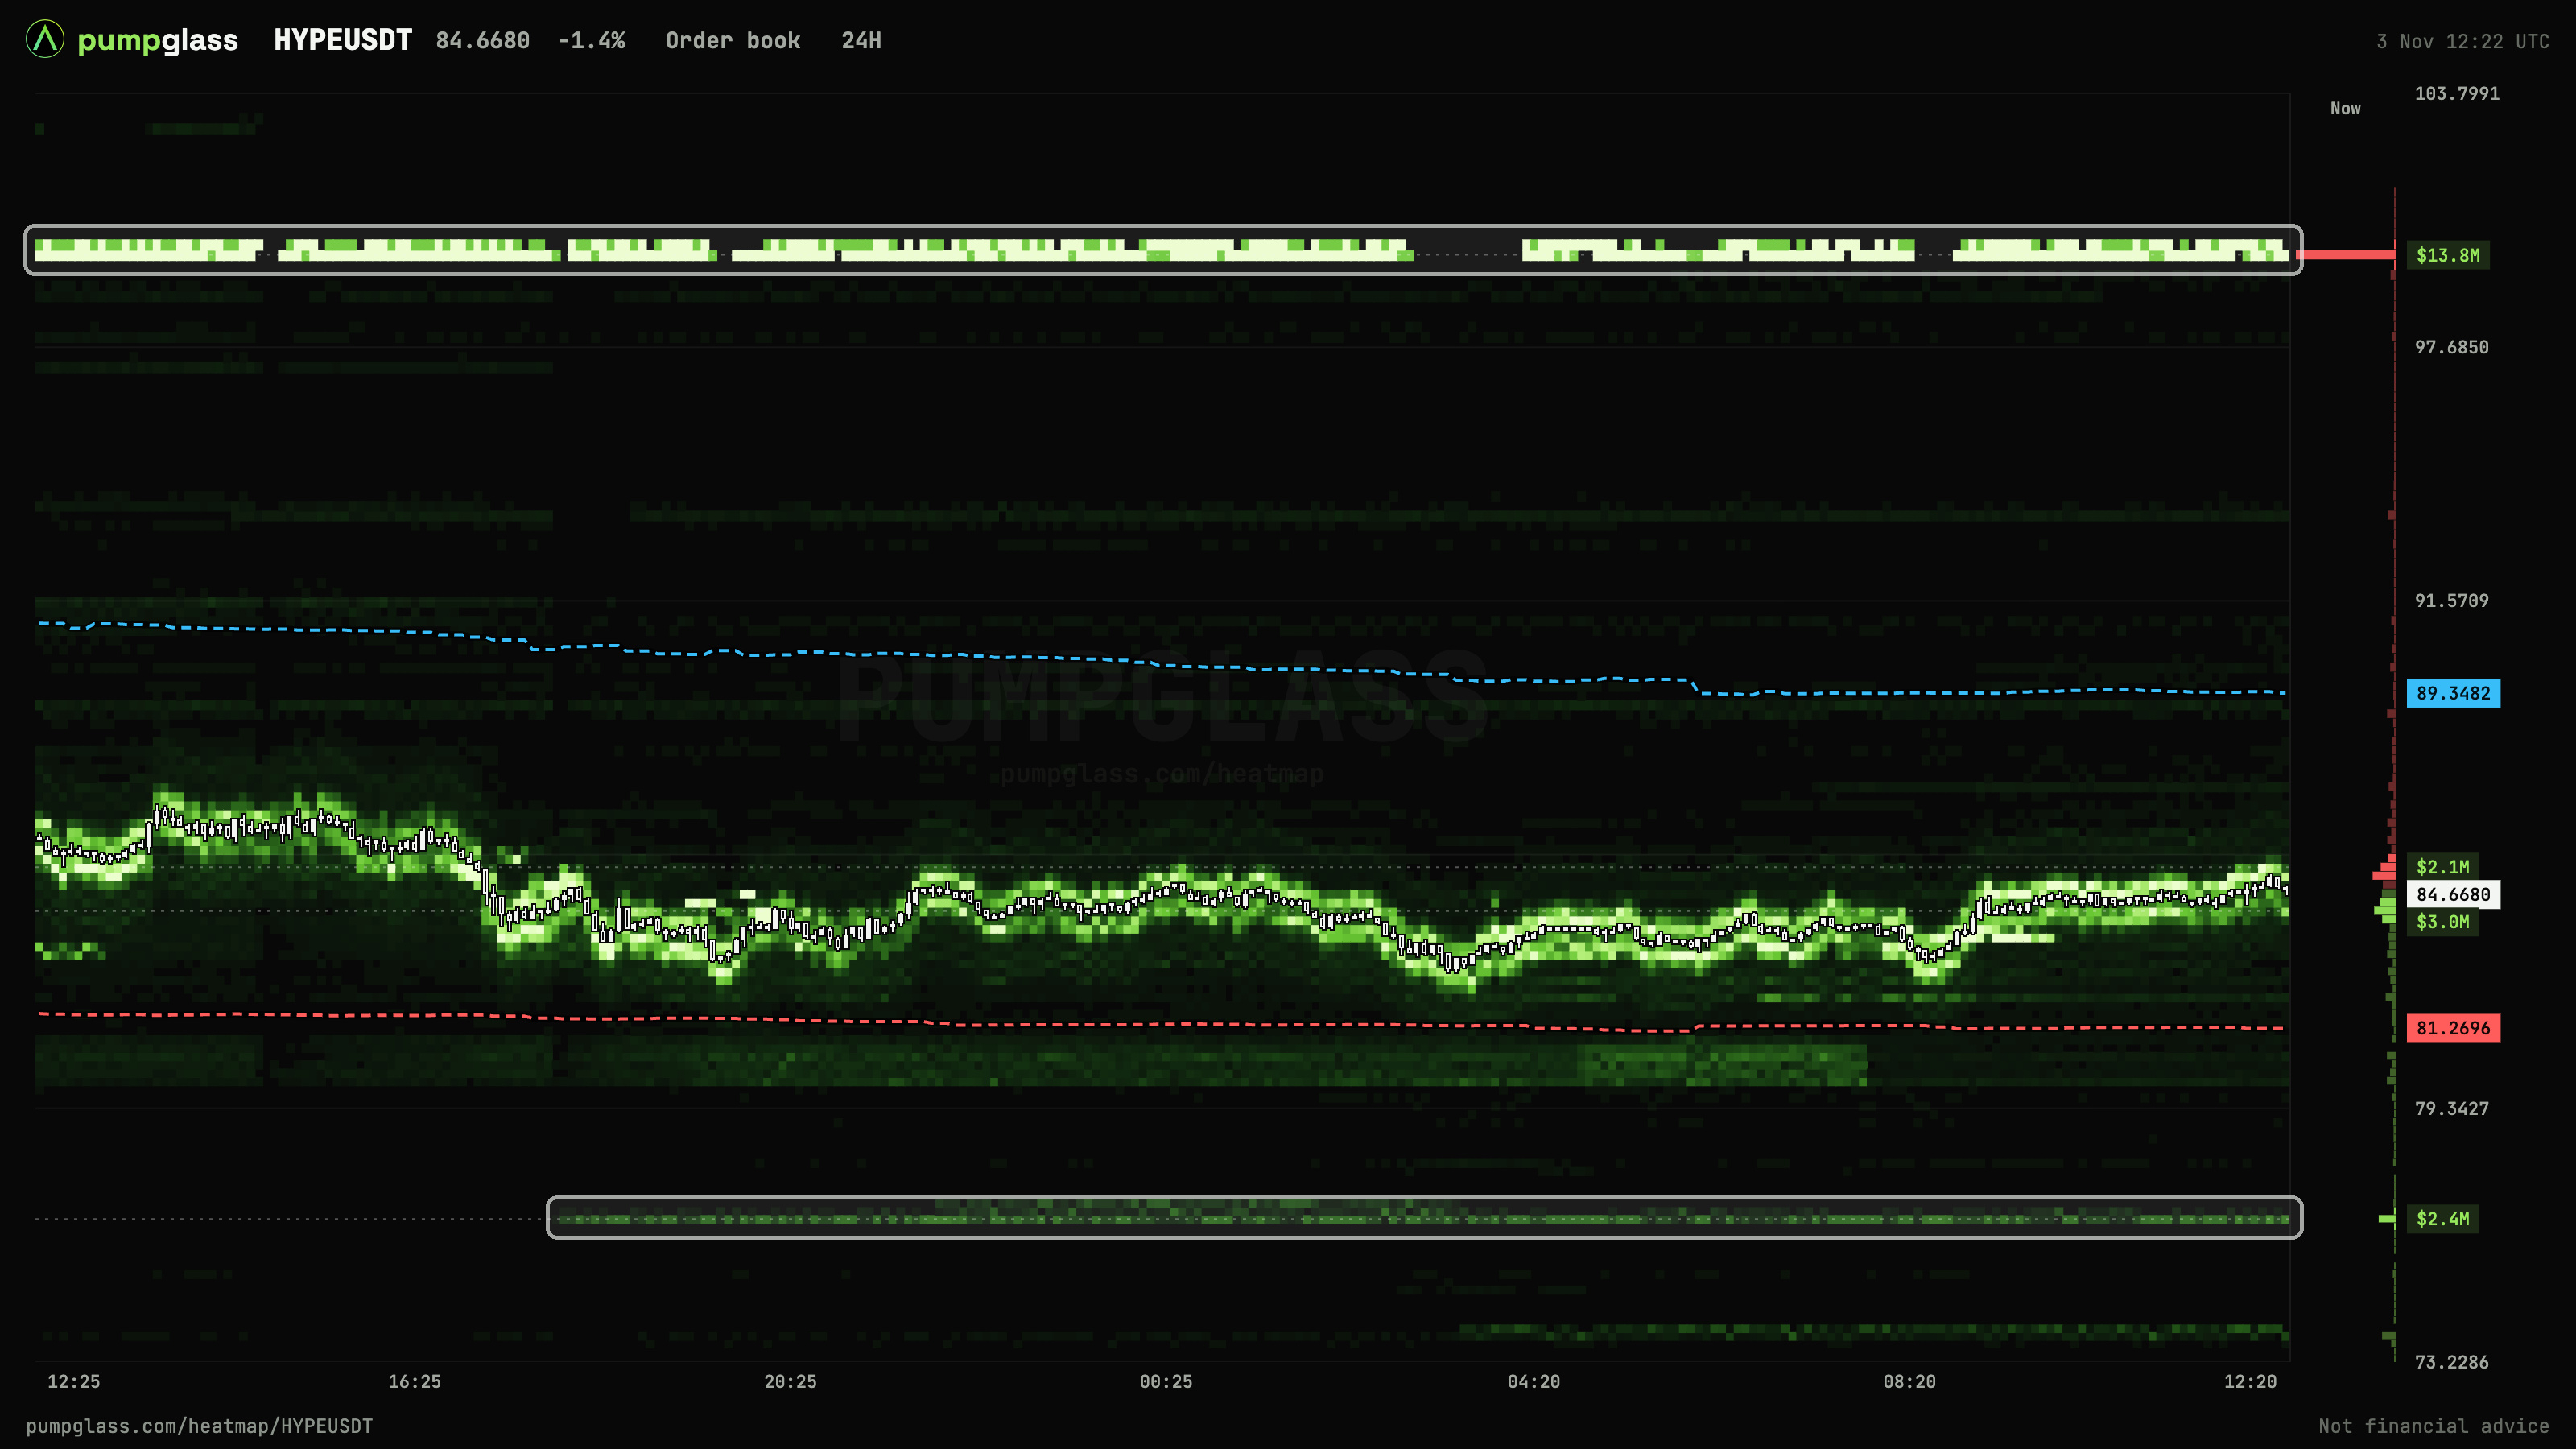
A $13.8M sell order at $100 held the same price for 24 hours. That is a wall. The bands that crawl along with the candles are market makers moving their orders after the price. They do not hold a level.
Rule: a wall does not move.
The magnet myth, on $AIN:
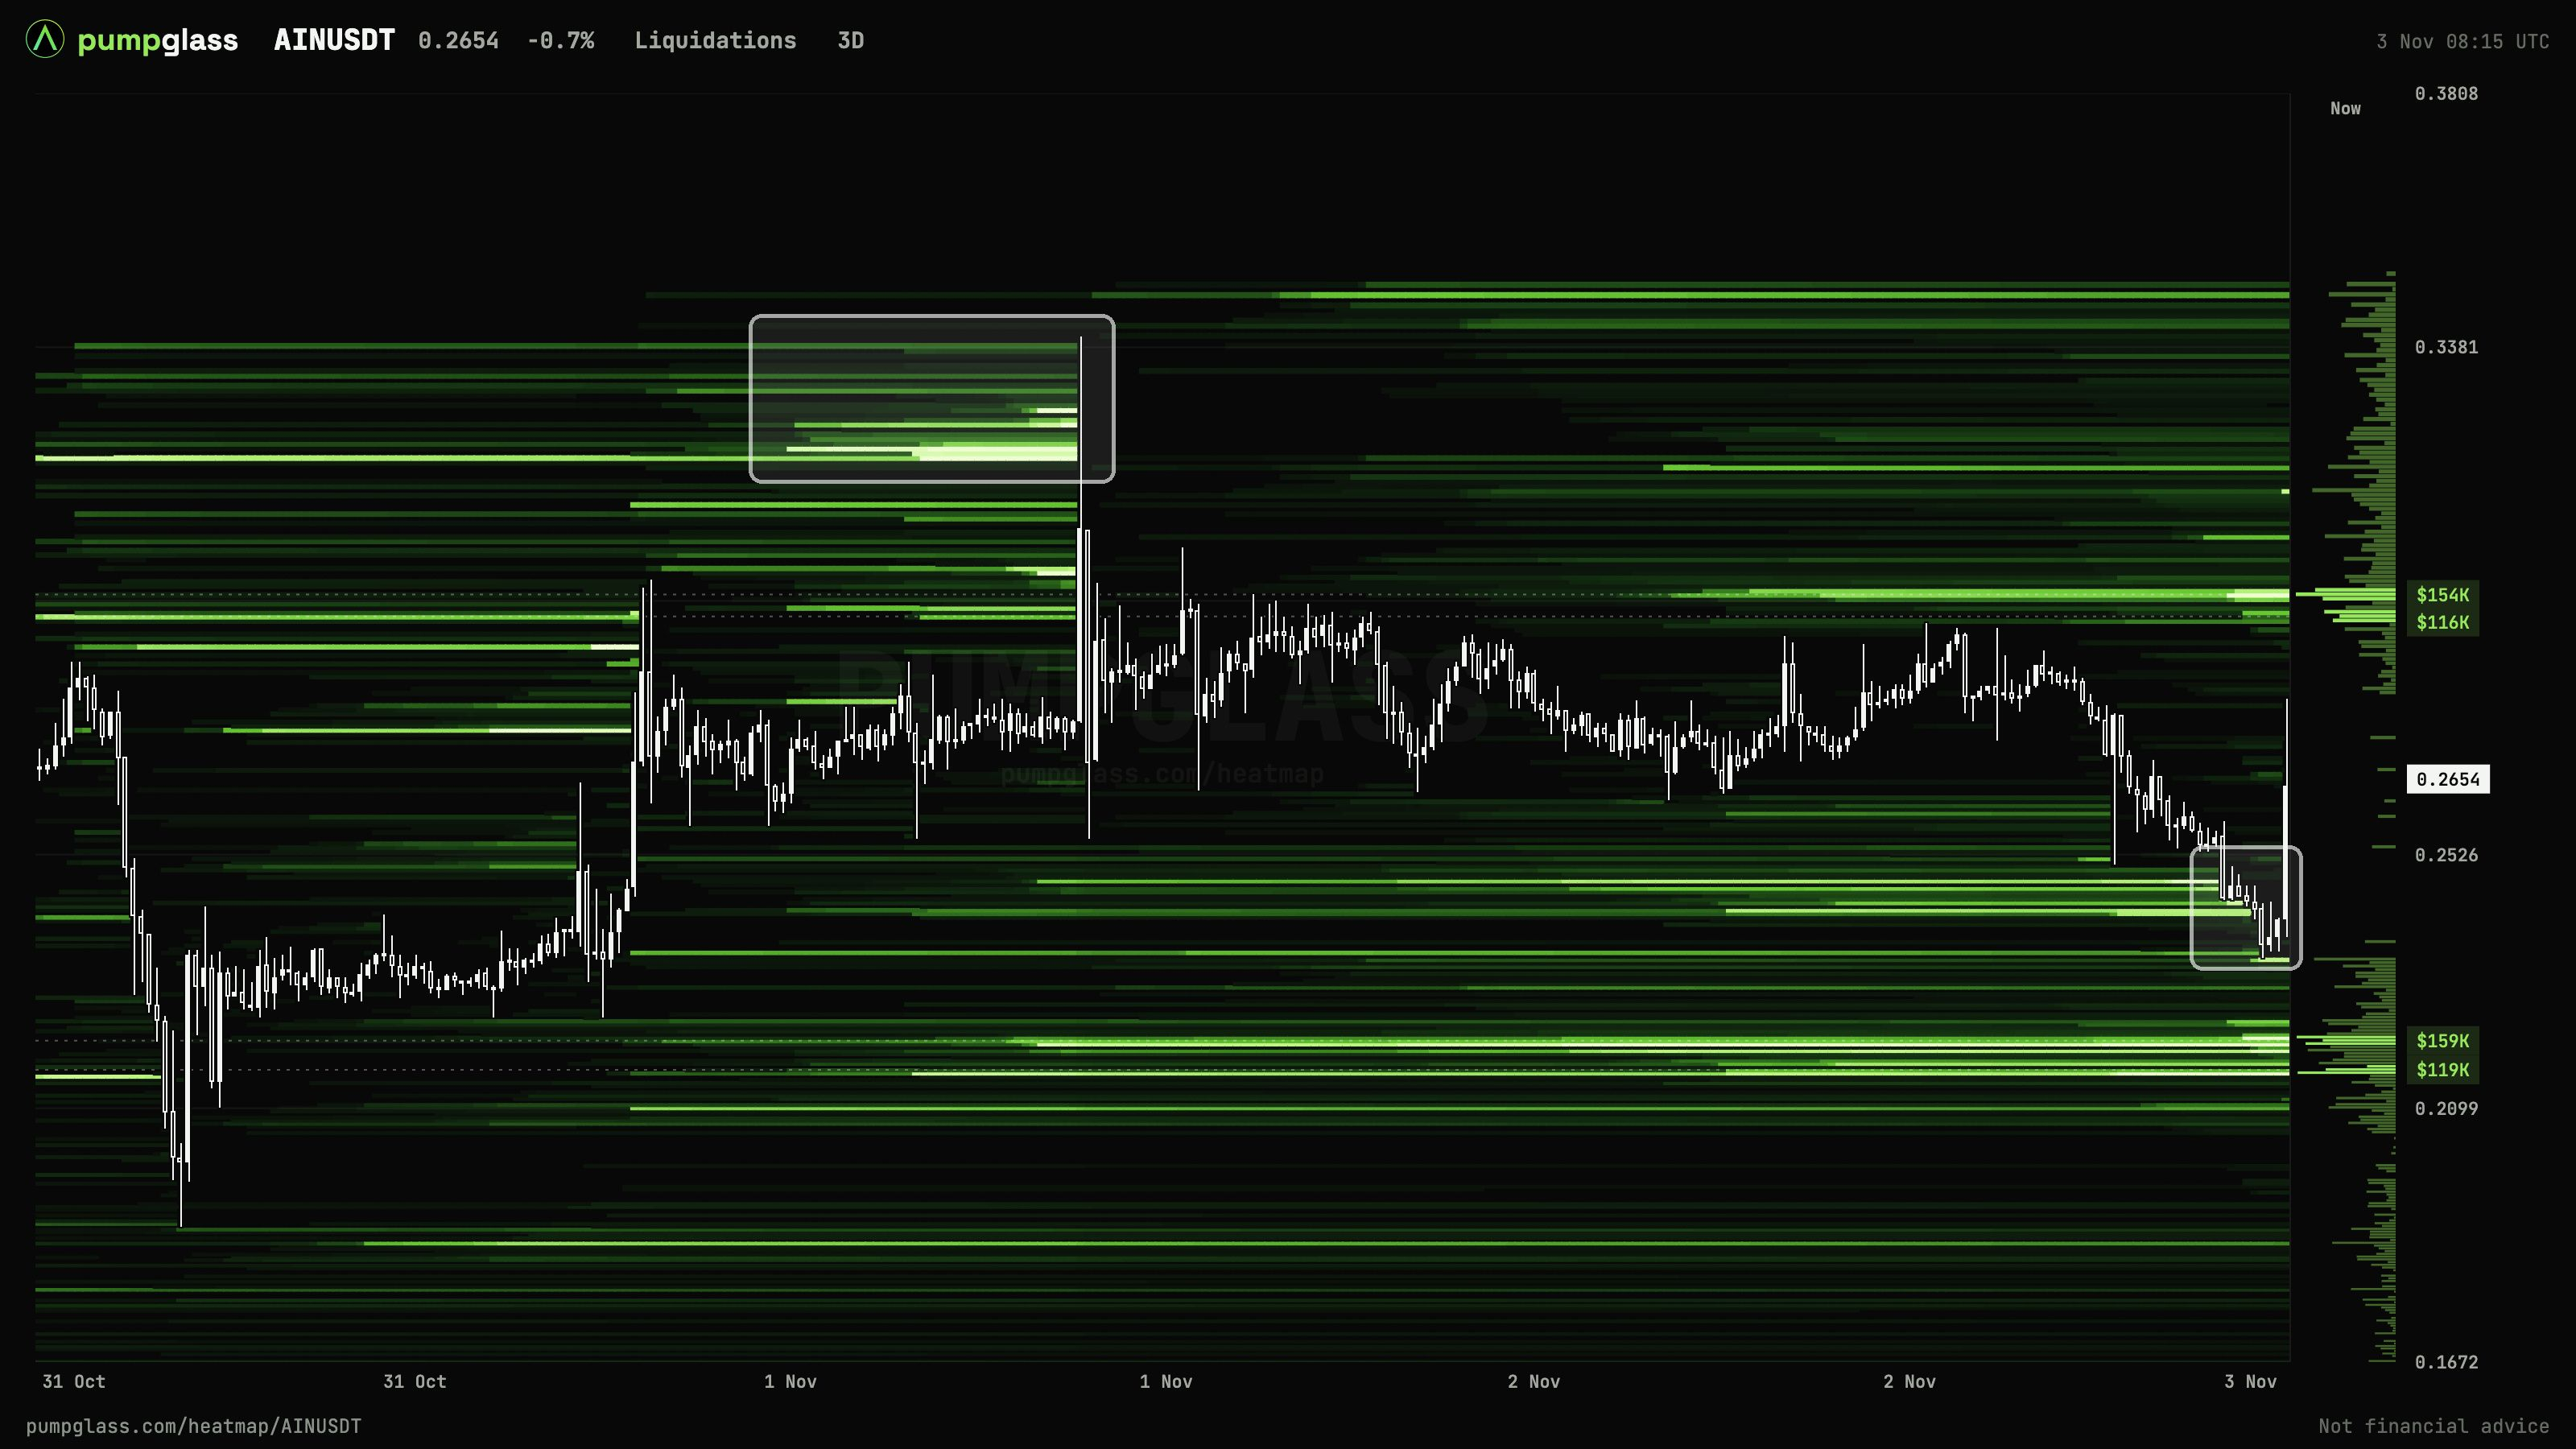
On November 1 a wick went through a cluster of shorts around $0.32. The bands ended exactly at the wick. Then the price went straight back to $0.275. Fuel burned, forced buying ran out.
Three rules:
A band that ends is gone. That fuel will not work twice.
Put your stop beyond a cluster, not inside it.
Check both liquidations and the order book.
Charts: PumpGlass liquidation heatmap, free for every Binance futures pair. Numbers are an example on November 3 data.
#Bitcoin #Liquidations #CryptoTrading #FuturesTrading #Binance