[OCTOBER 2 Bitcoin chart analysis]
BTCUSD 30Min Chart
*My analysis is optimized for TradingView.
If you press the replay button, you can check real-time movements.
-Long position strategy-
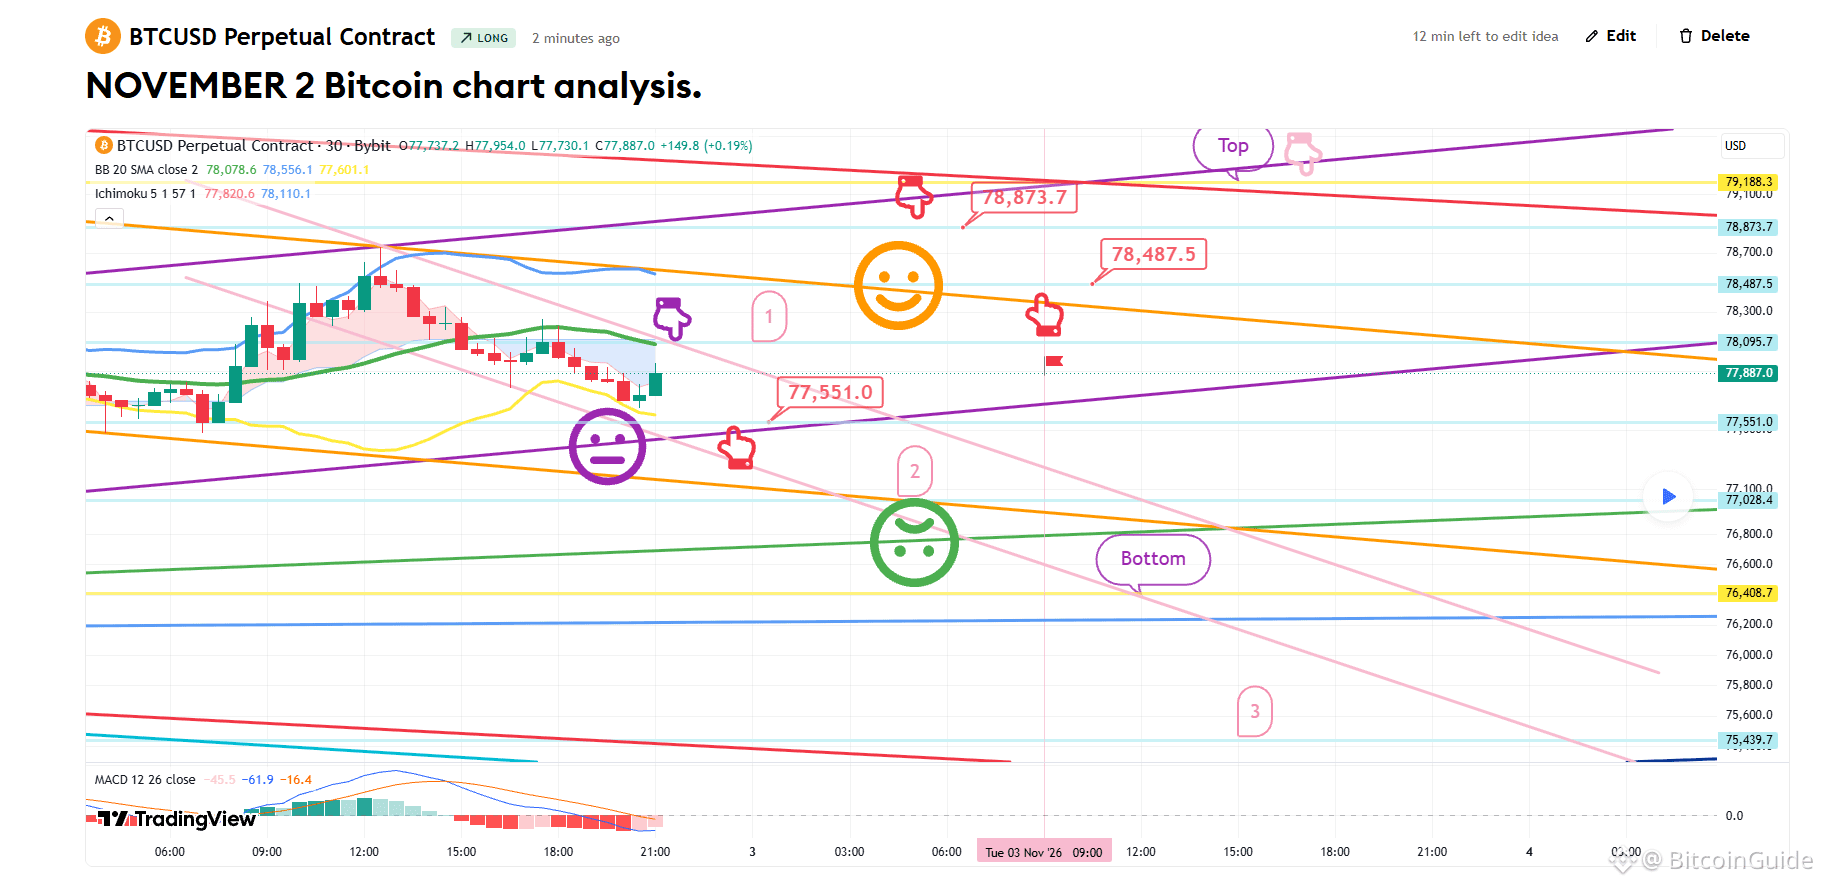
*Upon confirming a touch at the level marked with the purple finger (labeled '1'):
1) After confirming a touch at the first level ($78,095.7) — *optional short position possible here* — look to enter a long position at the level marked with the red finger ($77,551). Use the purple support line as your stop-loss level.
2) First target for the long position is $78,873.7; the second target is the top of the range.
- The $78.4K level can be used as a re-entry point for a long position.
- If the price drops without touching the level marked with the purple finger ('1'), wait for a long position entry at the second level (further down). Use the green support line as your stop-loss level.
- If the green support line is broken:
The price could potentially fall toward the bottom, with up to three levels of support to watch. If the light blue support line is also breached, the medium-term channel will be broken, which could mean a much longer wait for any potential recovery.
Please treat this analysis as a reference only.
Trade according to your established principles, always use stop-losses, and stay safe.
I post the analysis results as a Comment every day.
Thank you.
(You can find the link on my profile.)
- Click Follow to receive faster information every day.
- Check the results using the replay button on TradingView.
#BTC Price Analysis# #Crypto# #Altcoin Season# $USDT $BNB $BTC $ETH
BTCUSD 30Min Chart
*My analysis is optimized for TradingView.
If you press the replay button, you can check real-time movements.
-Long position strategy-
*Upon confirming a touch at the level marked with the purple finger (labeled '1'):
1) After confirming a touch at the first level ($78,095.7) — *optional short position possible here* — look to enter a long position at the level marked with the red finger ($77,551). Use the purple support line as your stop-loss level.
2) First target for the long position is $78,873.7; the second target is the top of the range.
- The $78.4K level can be used as a re-entry point for a long position.
- If the price drops without touching the level marked with the purple finger ('1'), wait for a long position entry at the second level (further down). Use the green support line as your stop-loss level.
- If the green support line is broken:
The price could potentially fall toward the bottom, with up to three levels of support to watch. If the light blue support line is also breached, the medium-term channel will be broken, which could mean a much longer wait for any potential recovery.
Please treat this analysis as a reference only.
Trade according to your established principles, always use stop-losses, and stay safe.
I post the analysis results as a Comment every day.
Thank you.
(You can find the link on my profile.)
- Click Follow to receive faster information every day.
- Check the results using the replay button on TradingView.
#BTC Price Analysis# #Crypto# #Altcoin Season# $USDT $BNB $BTC $ETH