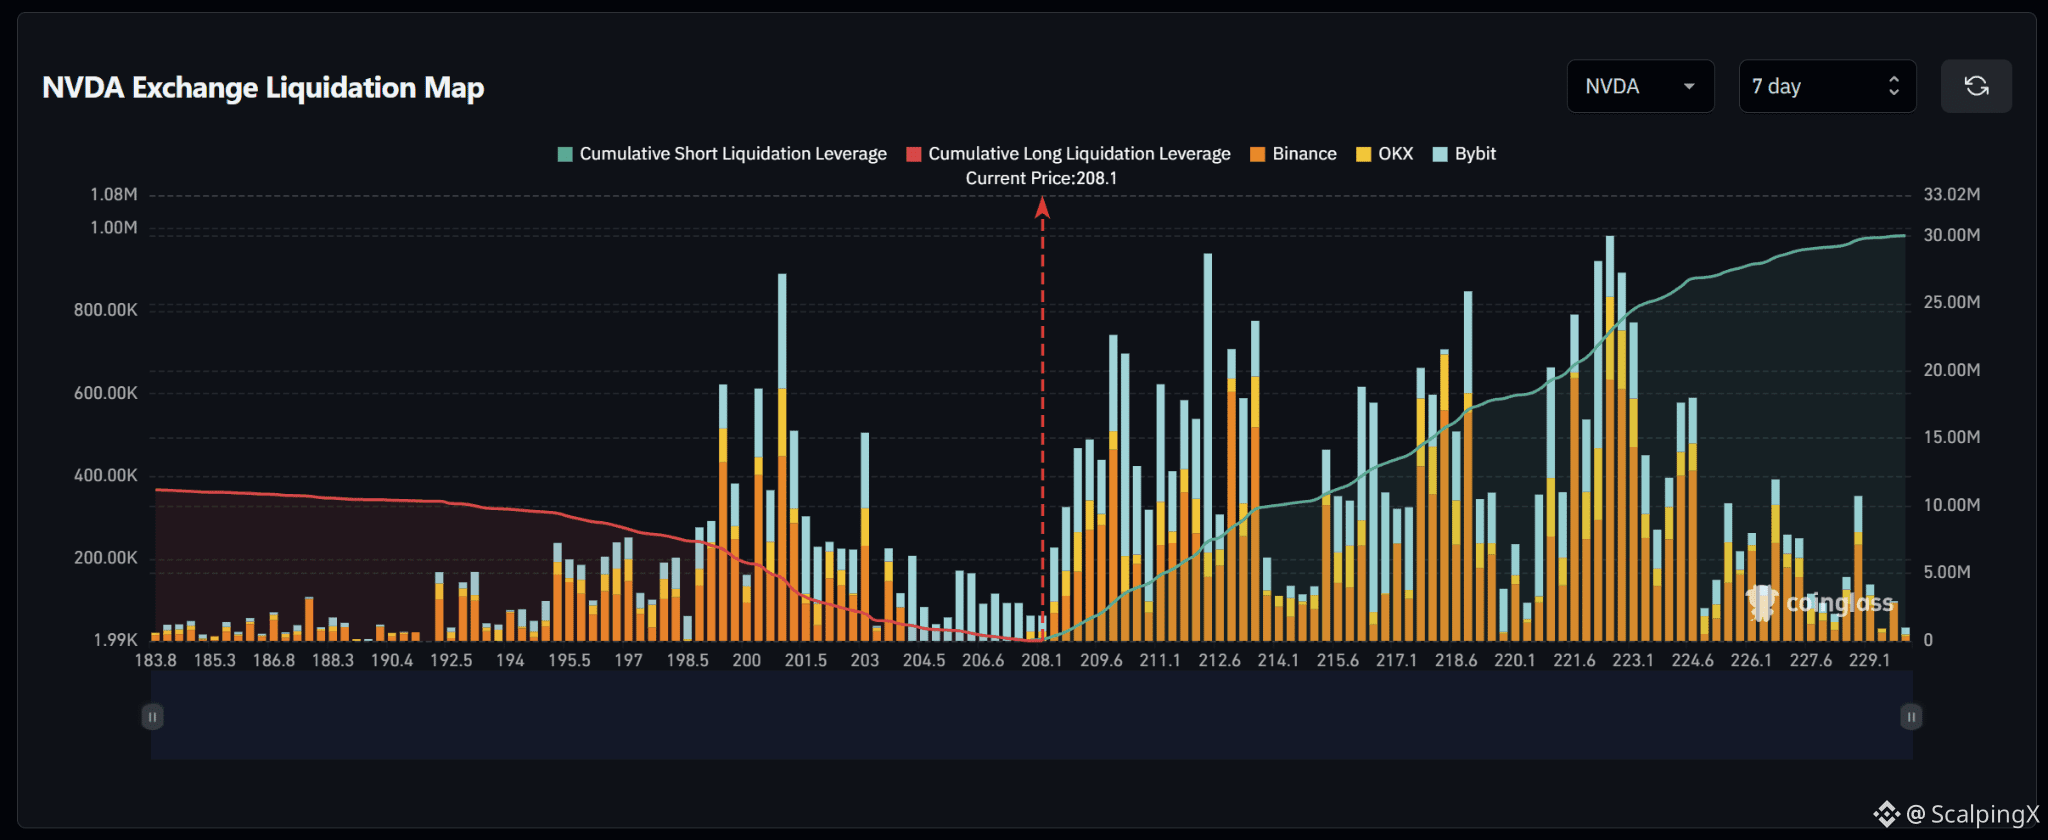
$NVDA – Liquidation Map (7 days) – Index ~208.1
🧭 The preferred scenario is an upside short sweep. Liquidation clusters are concentrated across 209–213.7, while exposure immediately below price is relatively sparse. Estimated cumulative short liquidation exposure is roughly $30 million across the displayed range, versus about $11 million on the long side.
🔺 A break and hold above 209.6 brings 210–210.3 into focus, followed by 211–213.7. The large bar near 212.3 stands out; short liquidations within this band could amplify an advance.
🎯 Holding above 213.7 after the sweep would shift attention to 215.3–216.8 and 217.6–219.2. Farther up, 221–223.3 contains another major concentration, with the map’s largest liquidation bar near 222.5.
⚖️ Losing 207.5 without a reclaim would weaken the upside scenario and shift attention to 205.5–206.5, then 202.5–204. A stronger long cluster sits at 199.4–201.6. Avoid chasing a sweep of 211–213.7 that quickly reverses below 211.
#LiquidationMap
🧭 The preferred scenario is an upside short sweep. Liquidation clusters are concentrated across 209–213.7, while exposure immediately below price is relatively sparse. Estimated cumulative short liquidation exposure is roughly $30 million across the displayed range, versus about $11 million on the long side.
🔺 A break and hold above 209.6 brings 210–210.3 into focus, followed by 211–213.7. The large bar near 212.3 stands out; short liquidations within this band could amplify an advance.
🎯 Holding above 213.7 after the sweep would shift attention to 215.3–216.8 and 217.6–219.2. Farther up, 221–223.3 contains another major concentration, with the map’s largest liquidation bar near 222.5.
⚖️ Losing 207.5 without a reclaim would weaken the upside scenario and shift attention to 205.5–206.5, then 202.5–204. A stronger long cluster sits at 199.4–201.6. Avoid chasing a sweep of 211–213.7 that quickly reverses below 211.
#LiquidationMap