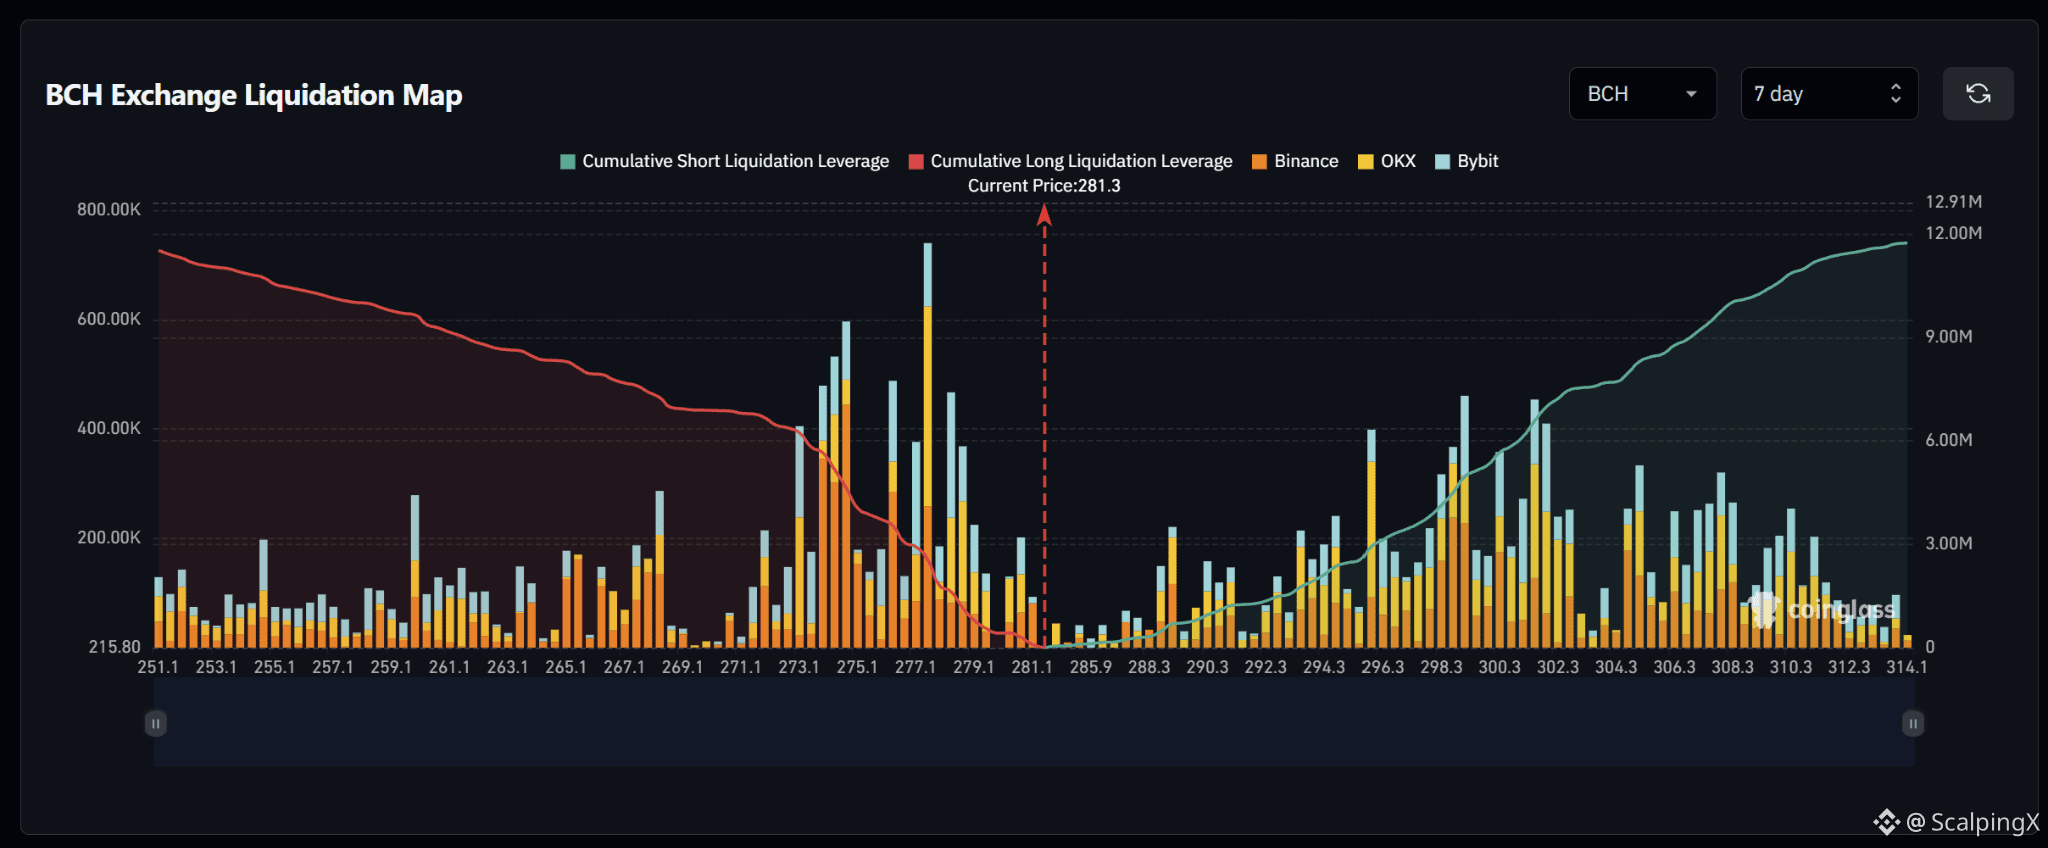
$BCH – Liquidation Map (7 days) – Index ~281.3
🧭 The preferred scenario is a downside long sweep first. Cumulative liquidation exposure is broadly balanced across the displayed range, but the dense long band at 273–279 sits closer to price than the major short clusters around 294–303.
🔻 The first zone to watch is 279–280.8. Losing 279 without a reclaim shifts attention to 276.5–278.5, particularly near 277.6, which has the map’s largest liquidation bar.
🎯 Long liquidations there could amplify the decline. A further break below 276.5 brings 273–275 into focus. Conversely, a downside sweep followed by a quick reclaim of 279 would weaken the case for further declines.
⚖️ A break and hold above 285.9 shifts priority to short clusters at 288.5–291, then 293.5–296.5. Holding above 296.5 brings 298.5–303 into focus. Avoid chasing a decline if price sweeps a long cluster and quickly recovers.
#LiquidationMap
🧭 The preferred scenario is a downside long sweep first. Cumulative liquidation exposure is broadly balanced across the displayed range, but the dense long band at 273–279 sits closer to price than the major short clusters around 294–303.
🔻 The first zone to watch is 279–280.8. Losing 279 without a reclaim shifts attention to 276.5–278.5, particularly near 277.6, which has the map’s largest liquidation bar.
🎯 Long liquidations there could amplify the decline. A further break below 276.5 brings 273–275 into focus. Conversely, a downside sweep followed by a quick reclaim of 279 would weaken the case for further declines.
⚖️ A break and hold above 285.9 shifts priority to short clusters at 288.5–291, then 293.5–296.5. Holding above 296.5 brings 298.5–303 into focus. Avoid chasing a decline if price sweeps a long cluster and quickly recovers.
#LiquidationMap