$ETH
Head & Shoulders: Bears Eye Control
◆━━━━━━━━━━━━━━━━━━
Market Overview
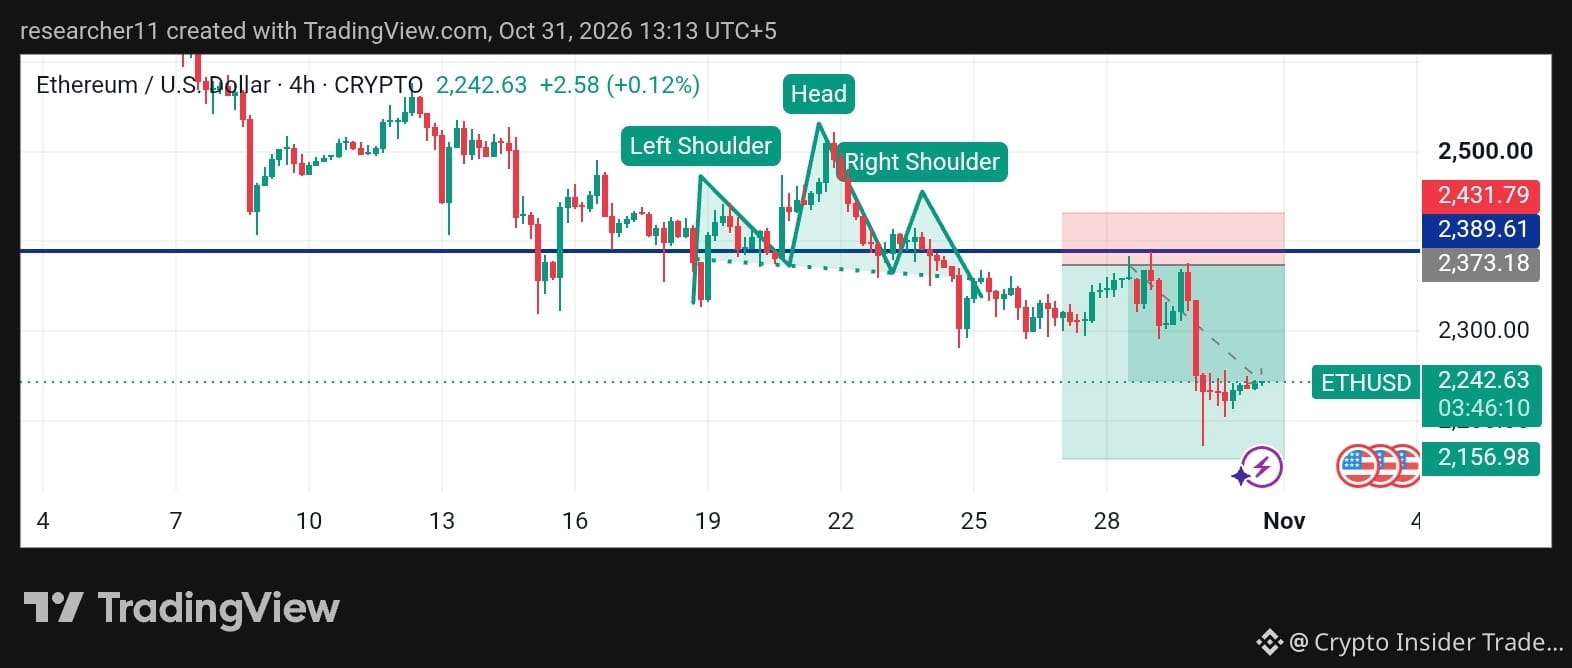
Ethereum is trading near $2,242 on the 4H chart after a strong drop from the $2,370–$2,430 area. Volatility increased during the sell-off, and price is now moving sideways with small candles. The overall trend is bearish in the short term.
Technical Analysis
ETH formed a clear Head and Shoulders pattern, a classic bearish reversal structure. The neckline broke, and price followed through lower, confirming the pattern.
Resistance near $2,389 rejected price multiple times, forming a strong supply zone. Price is now hovering above the $2,156 support area. The bounce is weak so far, which suggests buyers lack strong momentum.
🟢 Bullish Case
A 4H close above $2,373 would show buyers recovering. A move back above $2,389 would weaken the bearish pattern and could target $2,431.
🔴 Bearish Case
A breakdown below $2,156 would confirm trend continuation. The pattern's downside pressure could then extend toward lower support zones.
⚪ Neutral Case
ETH may consolidate between $2,156 and $2,300 while the market looks for direction. Low volume would support this range scenario.
Key Levels
➤ Resistance: R1: $2,373 | R2: $2,431
➤ Support: S1: $2,200 | S2: $2,156
Context
ETH often follows Bitcoin's lead. If BTC holds support, ETH may see a relief bounce. A BTC breakdown would add pressure.
Conclusion
The Head and Shoulders structure favors bears for now, but $2,156 is the key level to watch. Wait for confirmation and manage risk carefully.
This is not financial advice. Always do your own research.
◆━━━━━━━━━━━━━━━━━
#ETH #HeYiSaysWithdrawalsExpectedtoResumeWithin42Hours #CZSaysCompensationIsinPlaceUsersAreProtected #USDCCirculationFallsAbout800MInSevenDays #ASICHasReceivedNoPredictionMarketApplications