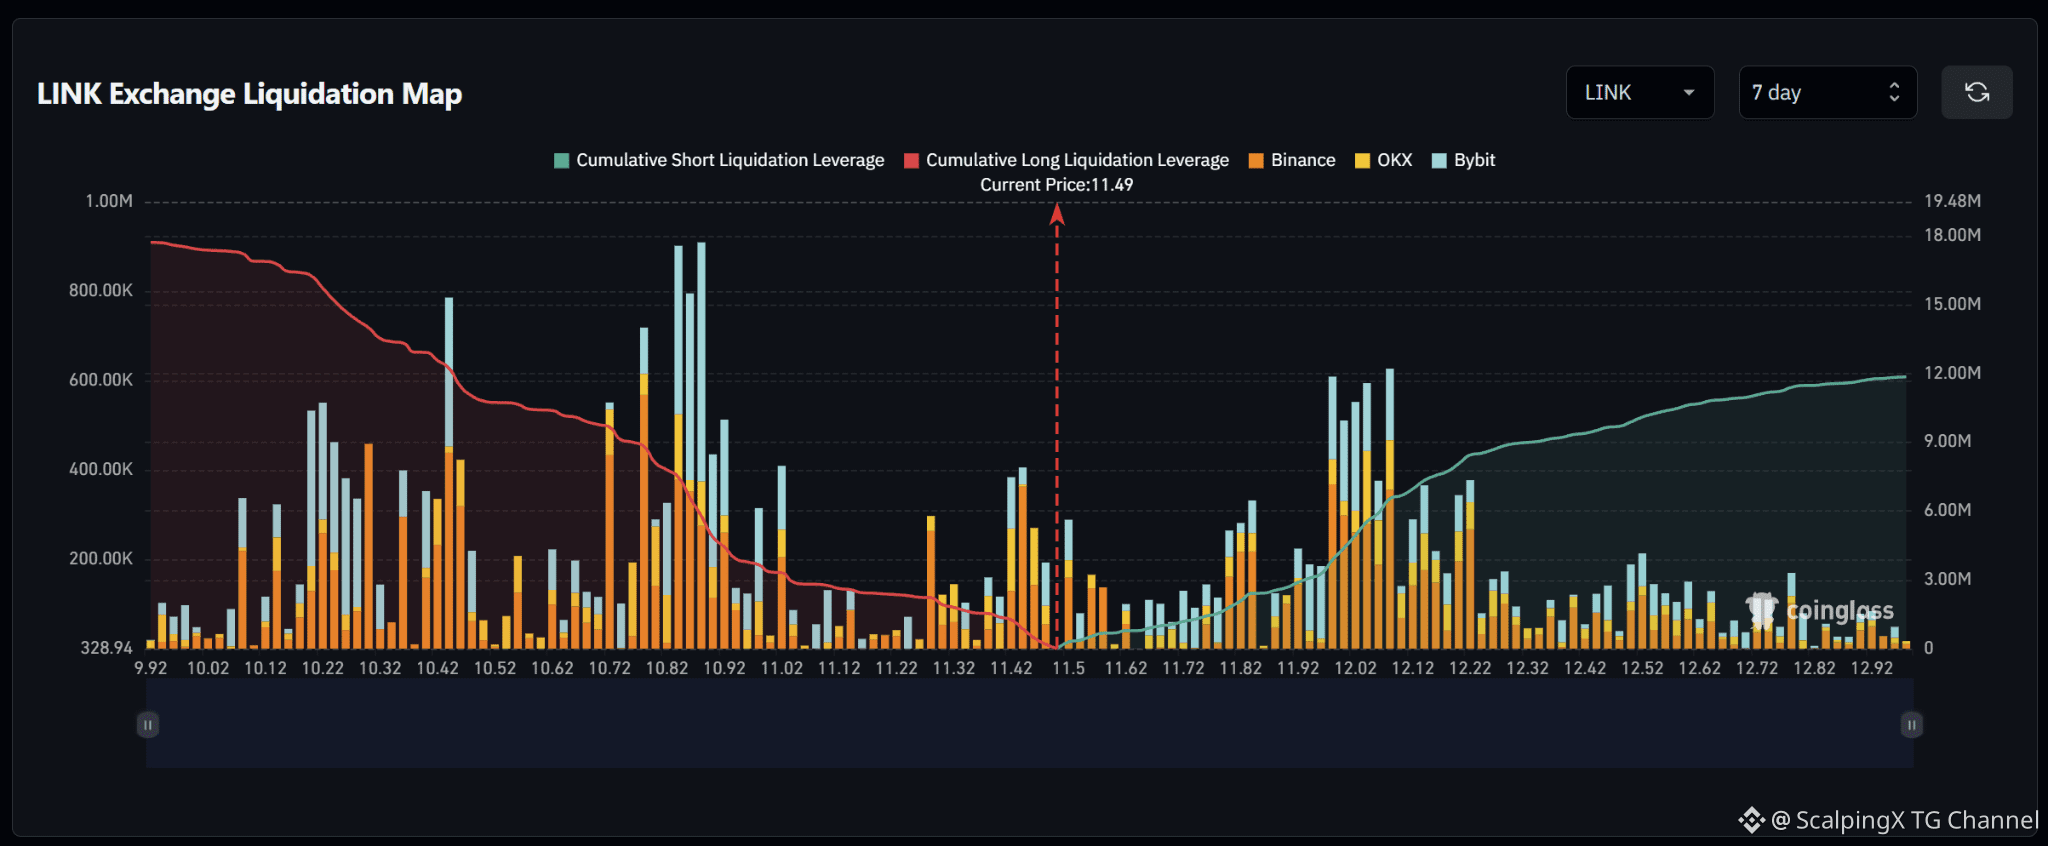
$LINK – Liquidation Map (7 days) – Index ~11.49
🧭 The preferred scenario is a nearby long sweep at 11.40–11.46 first. Estimated cumulative long liquidation exposure is nearly $18M, versus roughly $12M on the short side across the displayed range. The major upper short cluster sits farther away at 11.98–12.10.
🔻 Losing 11.40 without a reclaim shifts attention to 11.28–11.33. Liquidation density drops noticeably below that zone before clusters around 11.02 and 10.80–10.92.
🎯 The 10.80–10.92 band is the most prominent long cluster below, but remains a farther target if the decline continues. Conversely, a sweep of 11.40–11.46 followed by a quick reclaim of 11.49 would weaken the downside scenario.
⚖️ A break and hold above 11.55 shifts priority to short clusters at 11.80–11.85. Density between these zones is thin, requiring additional buying pressure to sustain the advance. Holding above 11.85 brings 11.98–12.10, then 12.14–12.22, into focus.
#LiquidationMap