

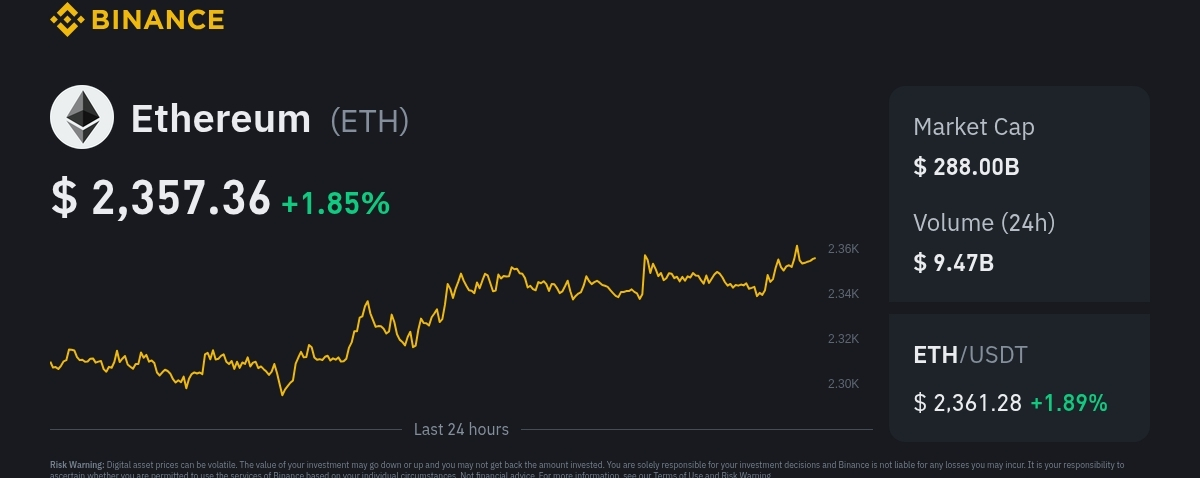

$ETH /USD Technical Analysis — October 31, 2026

Market: $ETH Ethereum / US Dollar · Short-term trading outlook

### $2,241.50
Latest reported reference price
Bearish bias
Ethereum is showing short-term bearish momentum. The latest technical analysis places ETH below important moving averages, with selling pressure still present. The price is approaching a potential support area, so a relief bounce is possible, but a confirmed reversal has not yet been established. Borearis +1
### 1\. Key support and resistance levels
| Level | Price (USD) | Significance |
| ----------------- | ----------- | -------------------------- |
| Resistance 3 | $2,293.62 | Higher breakout level |
| Resistance 2 | $2,278.24 | Near-term resistance |
| Pivot | $2,252.40 | Directional decision level |
| Current reference | $2,241.50 | Below pivot |
| Support 1 | $2,181.12 | First downside target |
| Support 2 | $2,165.88 | Important support |
| Support 3 | $2,150.64 | Further downside level |
These are reported technical reference levels, not guaranteed price targets. Borearis
### 2\. Trading scenarios
### Bearish scenario — preferred below $2,252
If ETH remains below $2,252.40, sellers may push the price toward:
* Target 1: $2,181
* Target 2: $2,166
* Target 3: $2,151
A decisive break below $2,150 could signal further weakness.
### Bullish scenario — only after confirmation
If ETH reclaims $2,252 and holds above it, a recovery toward these levels becomes possible:
* Target 1: $2,278
* Target 2: $2,294
A stronger recovery would require buyers to overcome the next resistance areas.
### 3\. Possible trading plan
| Setup | Entry condition | Target | Risk control |
| ----- | ----------------------------- | ------------- | ------------------------------- |
| Short | Rejection near $2,252–$2,278 | $2,181 | Stop above confirmed swing high |
| Long | Break and retest above $2,252 | $2,278–$2,294 | Stop below retest low |
These are conditional setups, not confirmed signals. Avoid entering just because the price reaches a particular level.
### 4\. My conclusion
* Short-term: Bearish.
* Key decision level: $2,252.
* Downside area: $2,181–$2,151.
* Bullish recovery signal: A sustained move above $2,252, followed by a break of resistance.
* Risk: ETH is volatile, and a sharp bounce can occur even during a downtrend. Borearis +1
My preference is to wait for a clear rejection or a confirmed breakout rather than chase the current price. The quoted price and levels can change quickly, so verify them on your exchange before trading.
Are you trading ETH/USD on which timeframe?
Timeframe
5 min
15 min
1 hour
4 hour
Daily
Trading direction
Long
Short
Both
Get detailed analysis
For ed
ucational purposes only. This is not financial advice. Leverage increases the risk of rapid losses.