

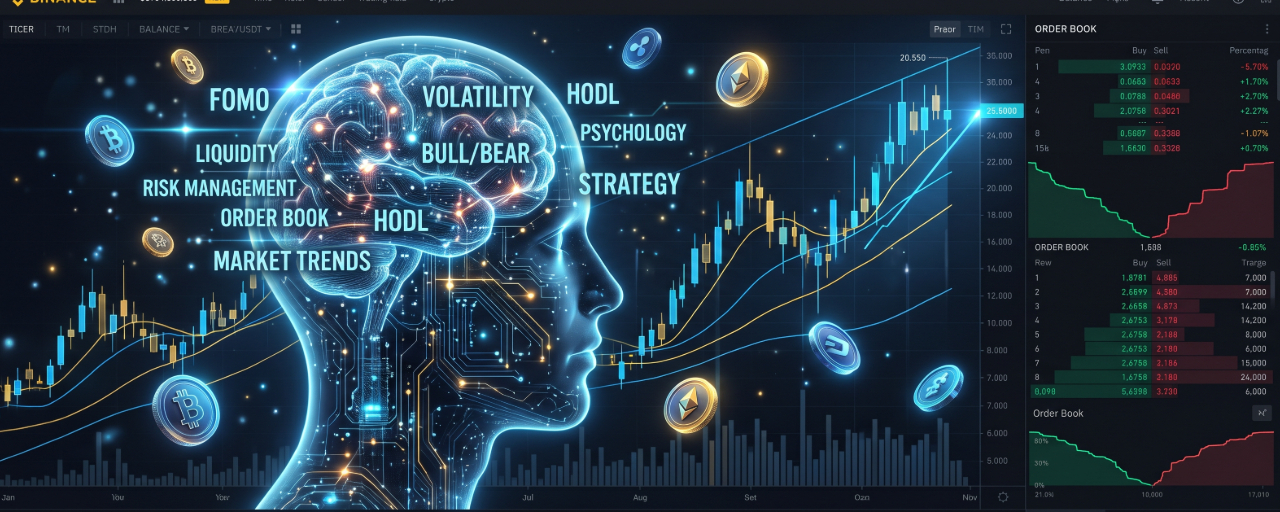

The difference between a beginner and a disciplined trader isn't always capital. Sometimes, it's simply understanding what is happening behind the charts.
Every day, thousands of people enter the cryptocurrency market because they see Bitcoin pumping, an altcoin making 40% gains, or someone posting screenshots of enormous profits.
They open an exchange, buy a random coin, watch a few green candles and assume they understand trading.
But here's the reality:
The market doesn't reward excitement. It rewards preparation, execution, discipline and risk management.
When beginners see a green candle, experienced traders may be looking at liquidity, volume, order-book depth, funding rates, token unlocks and market structure.
When beginners ask, "Can this coin reach $1?", experienced investors may ask, "What is its circulating supply, market capitalization and fully diluted valuation?"
And when beginners panic during a market crash, disciplined traders already know their invalidation levels, maximum acceptable loss and exit strategy.
Today, let's break down the terminology that every serious crypto trader should understand.
This isn't about memorizing complicated words to sound professional. It's about learning how the market actually works.
━━━━━━━━━━━━━━━━━━━━
🏛️ MODULE 1: ORDER BOOKS, MARKET DEPTH & TRADE EXECUTION
Before you buy or sell any cryptocurrency, you need to understand how your orders interact with the market.
1. Order Book
An order book is a real-time list of outstanding buy and sell orders for a particular trading pair.
For example, imagine BTC/USDT is trading around $100,000.
The order book might look something like this:
SELL ORDERS (ASKS)
$100,100 — 2 BTC
$100,050 — 3 BTC
$100,020 — 5 BTC
BUY ORDERS (BIDS)
$99,990 — 4 BTC
$99,950 — 6 BTC
$99,900 — 8 BTC
The sell side represents people willing to sell at specific prices.
The buy side represents people willing to buy at specific prices.
Understanding this helps you see where liquidity is available and how much trading activity exists at different price levels.
However, remember that visible orders can be cancelled. An order book is useful information, not a guarantee of future price movement.
2. Bid, Ask and Spread
Three essential terms:
• BID: The highest price a buyer is currently willing to pay.
• ASK: The lowest price a seller is currently willing to accept.
• SPREAD: The difference between the best ask and best bid.
Example:
Best Bid = $99,990
Best Ask = $100,000
Spread = $10
A narrow spread generally indicates a more liquid market, while a wider spread can make entering and exiting positions more expensive.
For scalpers and high-frequency traders, even a small spread can significantly affect profitability.
3. Market Maker vs. Market Taker
This is one of the most misunderstood concepts in trading.
A MARKET MAKER generally provides liquidity by placing orders that rest in the order book.
A MARKET TAKER removes available liquidity by executing against existing orders.
Example:
You place a limit order to buy BTC at $99,000 while the market trades at $100,000.
Your order waits in the order book. You are generally acting as a maker.
However, if you place a market order and immediately buy from available sellers, you are a taker.
Important: A limit order is not automatically a maker order. A limit order that immediately matches existing liquidity can also be classified as a taker order.
Why does this matter?
Because many exchanges use different maker and taker fees. Understanding the difference can help reduce unnecessary trading costs.
4. Market Depth
Market depth describes the amount of available buy and sell liquidity at different price levels.
Imagine two cryptocurrencies:
Coin A has $5 million in buy and sell orders near its current price.
Coin B has only $30,000 in nearby orders.
A large market order could have a relatively small effect on Coin A but move Coin B's price dramatically.
This is why low-cap coins can experience extreme volatility.
5. Slippage
Slippage occurs when your executed trade price differs from the price you expected.
Example:
You want to buy $10,000 worth of a low-liquidity altcoin at $1.
But there aren't enough sellers at $1.
Your order fills at:
$1.00
$1.03
$1.06
$1.10
Your average execution price becomes higher than expected.
This is called slippage.
Slippage becomes particularly dangerous during:
• Sudden market crashes.
• Low-liquidity trading sessions.
• Major news announcements.
• Large market orders.
• Extremely volatile altcoin movements.
A coin can show impressive percentage gains on a chart while being surprisingly difficult to trade profitably.
━━━━━━━━━━━━━━━━━━━━
📊 MODULE 2: TOKENOMICS — WHY A CHEAP COIN ISN'T NECESSARILY A GOOD INVESTMENT
One of the biggest mistakes beginners make is judging a cryptocurrency by its unit price.
They see a coin worth $0.0001 and think it has enormous potential because it could reach $0.01.
But the price of one token tells you very little about the actual valuation of a project.
Professional investors pay attention to token supply, market capitalization, valuation and future dilution.
6. Circulating Supply
Circulating supply refers to the number of tokens currently available in the market.
For example:
Token price = $2
Circulating supply = 100 million
Market capitalization = $200 million.
The circulating supply is important because it helps determine how much of the project's token supply is already available to investors.
7. Total Supply
Total supply represents the number of tokens currently in existence, after accounting for tokens that have been burned.
It does not necessarily include every token that could ever be created.
8. Maximum Supply
Maximum supply is the maximum number of tokens that can ever exist, provided the protocol has a fixed supply cap.
Bitcoin is the classic example, with a maximum supply of 21 million BTC.
Not every cryptocurrency has a maximum supply.
Some projects use inflationary token models where new tokens can continue entering circulation.
9. Market Capitalization
Market capitalization is calculated as:
MARKET CAP = CURRENT PRICE × CIRCULATING SUPPLY
Example:
Token price = $5
Circulating supply = 50 million
Market cap = $250 million.
This is a better way of evaluating a project's market valuation than looking at its token price alone.
10. Fully Diluted Valuation (FDV)
FDV estimates the valuation of a cryptocurrency if its entire assumed token supply were circulating at the current price.
FDV = CURRENT PRICE × MAXIMUM SUPPLY
Where a maximum supply is not defined, total supply or another clearly stated supply assumption may be used.
Example:
Current price = $2
Circulating supply = 100 million
Total supply = 1 billion
Market Cap = $200 million
FDV = $2 billion
Notice something interesting?
The market cap is only $200 million, but the fully diluted valuation is $2 billion.
This means the currently circulating supply represents only 10% of the total supply.
That doesn't automatically mean the project is bad.
But it raises an important question:
What happens when the remaining tokens become available?
11. Token Unlocks and Vesting
Many crypto projects distribute tokens gradually to:
• Early investors.
• Founders and team members.
• Advisors.
• Ecosystem funds.
• Community incentives.
These tokens may be locked for a specific period and released according to a vesting schedule.
When a large quantity of previously locked tokens becomes available, the market may face increased potential selling pressure.
For example:
A project has 100 million circulating tokens.
Another 50 million tokens are scheduled to unlock next month.
That represents a potential 50% increase over the current circulating supply.
Not every unlocked token is immediately sold, but investors should understand the potential impact.
Before buying an altcoin, investigate:
Current circulating supply.
Total and maximum supply.
Upcoming unlock dates.
Percentage of supply held by insiders.
Long-term token distribution.
A strong project with poor token economics can still be a difficult investment.
━━━━━━━━━━━━━━━━━━━━
⚡ MODULE 3: FUTURES, LEVERAGE AND DERIVATIVES
Spot trading and futures trading are not the same thing.
In spot trading, you purchase an actual cryptocurrency.
In futures trading, you trade a contract whose value is linked to the underlying asset.
This introduces additional risks that beginners frequently underestimate.
12. Long Position
A long position means you are speculating that the price will increase.
Example:
You open a BTC long position at $100,000.
BTC increases to $103,000.
Your position gains value before fees and funding payments.
However, if BTC falls, your position loses value.
13. Short Position
A short position means you are speculating that the price will decrease.
Example:
You open a BTC short position at $100,000.
BTC falls to $95,000.
Your position gains value before fees and funding payments.
Shorting can be useful in bearish markets, but rapid upward movements can result in significant losses.
14. Leverage
Leverage allows you to control a position larger than your initial margin.
Example:
Your capital = $100
Leverage = 5x
Position size = $500
If the underlying asset increases by 3%, your approximate gross profit is:
$500 × 3% = $15.
That represents a 15% gain on your $100 margin, before fees and funding.
But what happens if the market falls by 3%?
Your approximate loss becomes $15, or 15% of your initial margin.
At 10x leverage, a 3% adverse move represents approximately 30% of the initial margin.
Leverage magnifies both profits and losses.
It does not make a bad trading strategy better.
15. Liquidation Price
Liquidation happens when your margin is no longer sufficient to support an open leveraged position.
The exchange may automatically close your position to prevent further losses.
Your exact liquidation price depends on:
• Leverage.
• Entry price.
• Margin mode.
• Maintenance margin.
• Position size.
• Trading fees and funding.
Cross margin and isolated margin also work differently.
ISOLATED MARGIN restricts the margin allocated to a particular position.
CROSS MARGIN uses available account margin to support positions, which can expose more of your balance to losses.
Never assume your liquidation price is simply a fixed percentage away from your entry.
16. Funding Rates
Perpetual futures contracts do not have a traditional expiration date.
Funding payments help keep their prices aligned with the underlying spot market.
There are two important conditions:
POSITIVE FUNDING RATE:
Long traders generally pay short traders.
NEGATIVE FUNDING RATE:
Short traders generally pay long traders.
A very high positive funding rate can suggest that long positioning is crowded.
Similarly, deeply negative funding may indicate excessive bearish positioning.
But funding rates are not standalone buy or sell signals.
A market can remain overleveraged for longer than expected.
17. Open Interest (OI)
Open interest represents the total number of outstanding derivative contracts that have not been closed or settled.
It helps traders understand activity in futures markets.
A few useful interpretations:
Price rising + OI rising:
New positions may be entering alongside the rally.
Price falling + OI rising:
New positions may be building during the decline.
Price rising + OI falling:
Short positions may be closing, contributing to the rally.
Price falling + OI falling:
Positions may be getting closed or liquidated.
These are interpretations, not guaranteed predictions. Always combine open interest with volume, funding and price action.
18. Liquidation Cascade
A liquidation cascade occurs when forced position closures trigger further price movement and additional liquidations.
Imagine BTC begins falling.
Leveraged long positions approach their liquidation prices.
The exchange closes those positions, creating additional selling pressure.
That selling pressure pushes BTC even lower, triggering more liquidations.
The same process can happen in reverse during a sharp rally.
This is one reason cryptocurrency markets can experience extremely violent movements within minutes.
━━━━━━━━━━━━━━━━━━━━
🐋 MODULE 4: LIQUIDITY, WHALES AND MARKET PSYCHOLOGY
Understanding market psychology is just as important as understanding technical indicators.
Large traders often need substantial liquidity to enter and exit their positions.
Retail traders, meanwhile, tend to place orders around obvious support, resistance and psychological price levels.
This creates interesting market behaviour.
19. Liquidity
Liquidity refers to how easily an asset can be bought or sold without significantly affecting its market price.
High-liquidity assets generally have:
• More trading activity.
• Deeper order books.
• Tighter bid-ask spreads.
• Greater ability to handle larger orders.
Low-liquidity assets can experience sharp price movements even when relatively little capital is traded.
This is particularly important when trading small-cap altcoins.
20. Liquidity Sweeps
A liquidity sweep happens when price moves beyond a visible high or low, triggering stop orders or other liquidity, before potentially reversing.
Example:
BTC has support around $95,000.
Many traders place stop-loss orders just below that level.
Price suddenly falls to $94,600, triggering stop orders, but then quickly recovers to $96,000.
Traders may interpret this as a liquidity sweep.
However, be careful with the terminology.
Not every wick below support is a deliberate stop hunt by a whale.
It can also result from normal market volatility, low liquidity or a sudden imbalance between buyers and sellers.
The important thing is to observe how price behaves after taking liquidity.
21. Stop-Loss
A stop-loss is an order or trading instruction designed to limit the loss on a position.
Example:
Entry price = $100
Stop-loss = $95
Your planned loss is approximately 5% of the position value, before fees and slippage.
A stop-loss protects you from allowing a small mistake to become a devastating loss.
However, stop orders are not guaranteed to execute at the exact trigger price during extreme volatility.
22. Take-Profit (TP)
A take-profit order helps close a position when it reaches a predefined profit target.
Example:
Entry = $100
TP1 = $105
TP2 = $110
TP3 = $120
A trader could close part of the position at each target rather than trying to predict the exact market top.
This is called scaling out.
It can help manage emotional decision-making.
23. Support and Resistance
SUPPORT is a price area where buying interest has historically been strong enough to slow or reverse a decline.
RESISTANCE is a price area where selling pressure has historically slowed or reversed an advance.
Neither is a guaranteed price barrier.
When support breaks, it may become resistance.
When resistance breaks, it may become support.
Traders often look for confirmation through volume, candle closes and retests rather than entering simply because price touches a line.
24. Breakout and Fakeout
A breakout occurs when price moves beyond an established support or resistance zone.
But not every breakout is genuine.
A fakeout occurs when price briefly moves beyond a key level but fails to sustain the movement and returns to its previous range.
Example:
BTC resistance = $100,000.
BTC moves to $101,000, attracting breakout buyers.
A few minutes later, it falls to $98,500.
Traders who entered without confirmation may become trapped.
This is why volume, market structure and confirmation matter.
━━━━━━━━━━━━━━━━━━━━
🧮 MODULE 5: RISK MANAGEMENT — THE DIFFERENCE BETWEEN SURVIVING AND BLOWING UP
This is arguably the most important module in the entire article.
You can understand every chart pattern, know every indicator and correctly identify promising cryptocurrencies.
But without risk management, a few bad trades can destroy your account.
25. Risk-to-Reward Ratio (R)
Risk-to-reward ratio compares the amount you are willing to lose against your potential profit.
Example:
You risk $10 to potentially make $30.
Risk = $10
Reward = $30
Your risk-to-reward ratio is 1:3.
This means you are targeting three dollars of potential profit for every dollar of planned risk.
A higher risk-to-reward ratio can reduce the win rate required to break even, assuming the planned outcomes are achieved.
26. Win Rate
Win rate tells you what percentage of your trades are profitable.
Example:
You make 20 trades.
12 are profitable.
8 are losses.
Your win rate is 60%.
But here's something beginners often misunderstand:
A high win rate does not automatically mean a profitable strategy.
Imagine:
You win $5 on each successful trade.
You lose $20 on each unsuccessful trade.
Even with a 60% win rate:
12 wins × $5 = $60
8 losses × $20 = $160
Net result = -$100 before fees.
A disciplined trader evaluates win rate together with average profit, average loss, fees and execution quality.
27. Position Sizing
Position sizing determines how much capital you allocate to a particular trade.
Suppose:
Trading account = $1,000
Maximum planned risk = 1%
Maximum acceptable loss = $10
Your entry is $100 and your stop-loss is $95.
The price difference is 5%.
To risk approximately $10:
Position size = $10 ÷ 5% = $200.
So, your position would be worth $200, rather than risking your entire $1,000 account.
This is a simplified calculation. Fees, slippage and funding must also be considered.
Position sizing is often more important than finding the perfect entry.
28. Risk of Ruin
Risk of ruin describes the possibility of losing so much capital that continuing to trade becomes impractical.
Consider two traders:
Trader A risks 20% of their account on each trade.
Trader B risks 1% per trade.
A series of consecutive losses can devastate Trader A's account, while Trader B has significantly more room to recover.
Remember:
Losing 50% of your portfolio requires a 100% gain just to return to your starting balance.
Protecting capital is not boring.
It is a survival strategy.
━━━━━━━━━━━━━━━━━━━━
🌐 MODULE 6: DEFI — UNDERSTANDING THE OTHER SIDE OF CRYPTO
Cryptocurrency isn't only about buying Bitcoin and trading altcoins.
Decentralized Finance (DeFi) introduces another world of financial applications built using blockchain networks and smart contracts.
29. Smart Contracts
Smart contracts are programs deployed on blockchains that execute when predefined conditions are met.
They can power:
• Decentralized exchanges.
• Lending protocols.
• Token swaps.
• Liquidity pools.
• Automated financial applications.
However, smart contracts can contain vulnerabilities.
A project being decentralized does not automatically make it safe.
30. Automated Market Maker (AMM)
An AMM is a mechanism used by decentralized exchanges to facilitate trades through liquidity pools rather than relying exclusively on traditional order books.
For example, an ETH/USDT pool contains ETH and USDT.
Traders can swap between these assets using the pool's pricing mechanism.
Liquidity providers deposit assets into the pool and may earn trading fees.
31. Impermanent Loss
Impermanent loss occurs when the relative prices of assets deposited into a liquidity pool change compared with simply holding those assets.
Example:
You deposit equal values of ETH and USDT into a liquidity pool.
ETH experiences a significant price increase.
The AMM adjusts the pool's asset ratio as traders trade against it.
When you withdraw, your combined holdings may be worth less than if you had simply held the original ETH and USDT.
That difference is commonly called impermanent loss.
Trading fees and other rewards may offset some or all of that loss, but they do not guarantee profitability.
32. TVL (Total Value Locked)
TVL represents the total value of assets deposited into a DeFi protocol.
A higher TVL can indicate substantial participation, but it does not automatically mean a protocol is secure or sustainable.
Always investigate:
• Smart-contract audits.
• Protocol history.
• Liquidity concentration.
• Token incentives.
• Security incidents.
• Withdrawal conditions.
Never deposit money into a protocol simply because its TVL is large.
━━━━━━━━━━━━━━━━━━━━
🧠 MODULE 7: HOW TO THINK LIKE A DISCIPLINED TRADER
Let's compare two different approaches.
RETAIL TRADER:
"I saw a coin pumping 30%. I need to buy before it goes higher."
DISCIPLINED TRADER:
"What is driving the movement? Is volume increasing? Where is the next resistance? Is liquidity sufficient? What is my invalidation level?"
RETAIL TRADER:
"This coin is only $0.001. It can easily reach $1."
DISCIPLINED TRADER:
"What is the circulating supply? What would its market cap be at $1? Is that valuation realistic?"
RETAIL TRADER:
"I lost money. I need another trade to recover it."
DISCIPLINED TRADER:
"My setup failed. My predefined risk limit was respected. I'll wait for the next opportunity."
RETAIL TRADER:
"This influencer says the coin will 100x."
DISCIPLINED TRADER:
"What evidence supports that valuation? What are the token unlocks, liquidity conditions and downside risks?"
The biggest difference is that one approach is based on emotional reactions, while the other is based on a repeatable process.
━━━━━━━━━━━━━━━━━━━━
🎯 THE DAILY CRYPTO TRADER CHECKLIST
Before entering any position, ask yourself these questions:
1. Market Direction
Is Bitcoin trending upward, downward or sideways?
What is happening on the daily and 4-hour timeframes?
2. Market Structure
Are we seeing higher highs and higher lows, or lower highs and lower lows?
Where are the important support and resistance zones?
3. Volume Confirmation
Is the movement supported by meaningful trading volume?
Is the price moving on genuine demand or relatively thin liquidity?
4. Derivatives Data
What is the current funding rate?
Is open interest increasing or decreasing?
Are leveraged positions becoming excessively crowded?
5. Tokenomics
Is the cryptocurrency facing major token unlocks?
Is its FDV significantly higher than its market capitalization?
Who holds the majority of the supply?
6. Risk Management
Where is my entry?
Where is my stop-loss?
What is my take-profit?
How much money am I willing to lose?
7. Emotional Control
Am I entering because I have a strategy, or because I am afraid of missing an opportunity?
Would I still take this trade if nobody had posted about it on social media?
If you cannot answer these questions, you may not be ready to enter the position.
━━━━━━━━━━━━━━━━━━━━
FINAL THOUGHT: THE MARKET DOESN'T CARE ABOUT YOUR EXPECTATIONS
Crypto trading is not a competition to find the next 100x coin.
It is a continuous process of identifying opportunities, evaluating probabilities, controlling risk and managing uncertainty.
You do not need to win every trade.
You do not need to predict every Bitcoin movement.
And you certainly do not need to trade every single day.
The goal is to develop a strategy that can survive different market conditions.
Learn the terminology. Understand the mechanics. Study the data. Control your emotions.
Most importantly, never confuse a lucky trade with actual trading skill.
A trader's first responsibility is not to make money. It is to stay in the game long enough to develop an edge.
👇 LET'S MAKE THIS INTERESTING:
Which of these concepts do you find the most difficult to understand?
Order Book & Liquidity
Market Cap & FDV
Futures, Leverage & Liquidations
Funding Rates & Open Interest
Liquidity Sweeps & Market Structure
Risk Management & Position Sizing
DeFi & Impermanent Loss
Comment with your number.
I'll use the most requested topic for a deeper practical breakdown with real-world examples in the next educational post.
Learn before you trade. Protect before you profit.
#cryptoeducation #BinanceSquare #TradingForBeginners #CryptoTrading #RiskManagement