$AMZN
Slides 4%: Resistance Now in Control
Market Overview
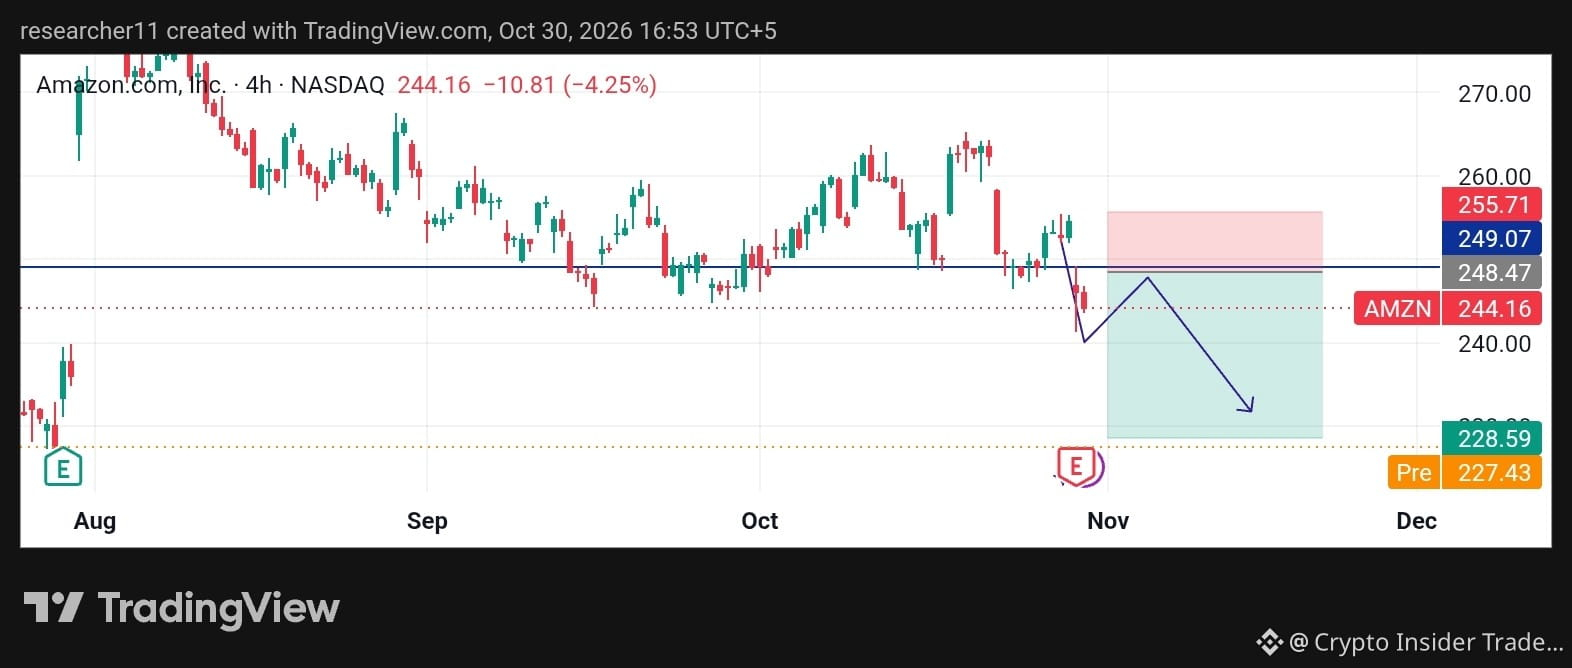
Amazon (AMZN) is trading near 244.16 on the 4H chart, down about 4.25% in a sharp move. After failing to hold gains in late October, sellers pushed price below the range that had contained trading for weeks, and volatility has picked up.
━━━━━━━━━━━━━━━
Technical Analysis
The 248–249 zone, which previously acted as support, has flipped into resistance. Price is now trading below it, a bearish sign. A pullback to retest this area before any further move down would be a common pattern.
Immediate support sits at 240, then the larger 228.59 level. Pre-market near 227.43 shows downside pressure remains in play. Above, 255.71 marks the level that would invalidate the bearish structure.
Strong selling candles on the drop suggest sellers are active, but a quick recovery above 249 would challenge that view.
━━━━━━━━━━━━━━━
Scenario Analysis
🔴 Bearish Case: Price retests 248.47–249.07, gets rejected, and moves back toward 240 and 228.59.
🟢 Bullish Case: A 4H close above 249.07 would reclaim lost ground, with 255.71 as the next test.
⚪ Neutral Case: Price ranging between 240 and 248 would signal indecision.
━━━━━━━━━━━━━━━
Key Levels
🔺 Resistance: R1 248.47 | R2 255.71
🔻 Support: S1 240.00 | S2 228.59
━━━━━━━━━━━━━━━
Conclusion
AMZN is under pressure, but the key is how price behaves at the 248–249 retest. Rejection there strengthens the bearish case, while a reclaim shifts momentum back to buyers.
This is market analysis, not financial advice. Always do your own research.
#AMZNB
#KOSPIFalls3.53%BackBelow6000 #AmazonSharesFallAbout7%InPremarketTrading #USMidtermElections #TwoAddressesHoldingAbout1.28BUSDTFrozen