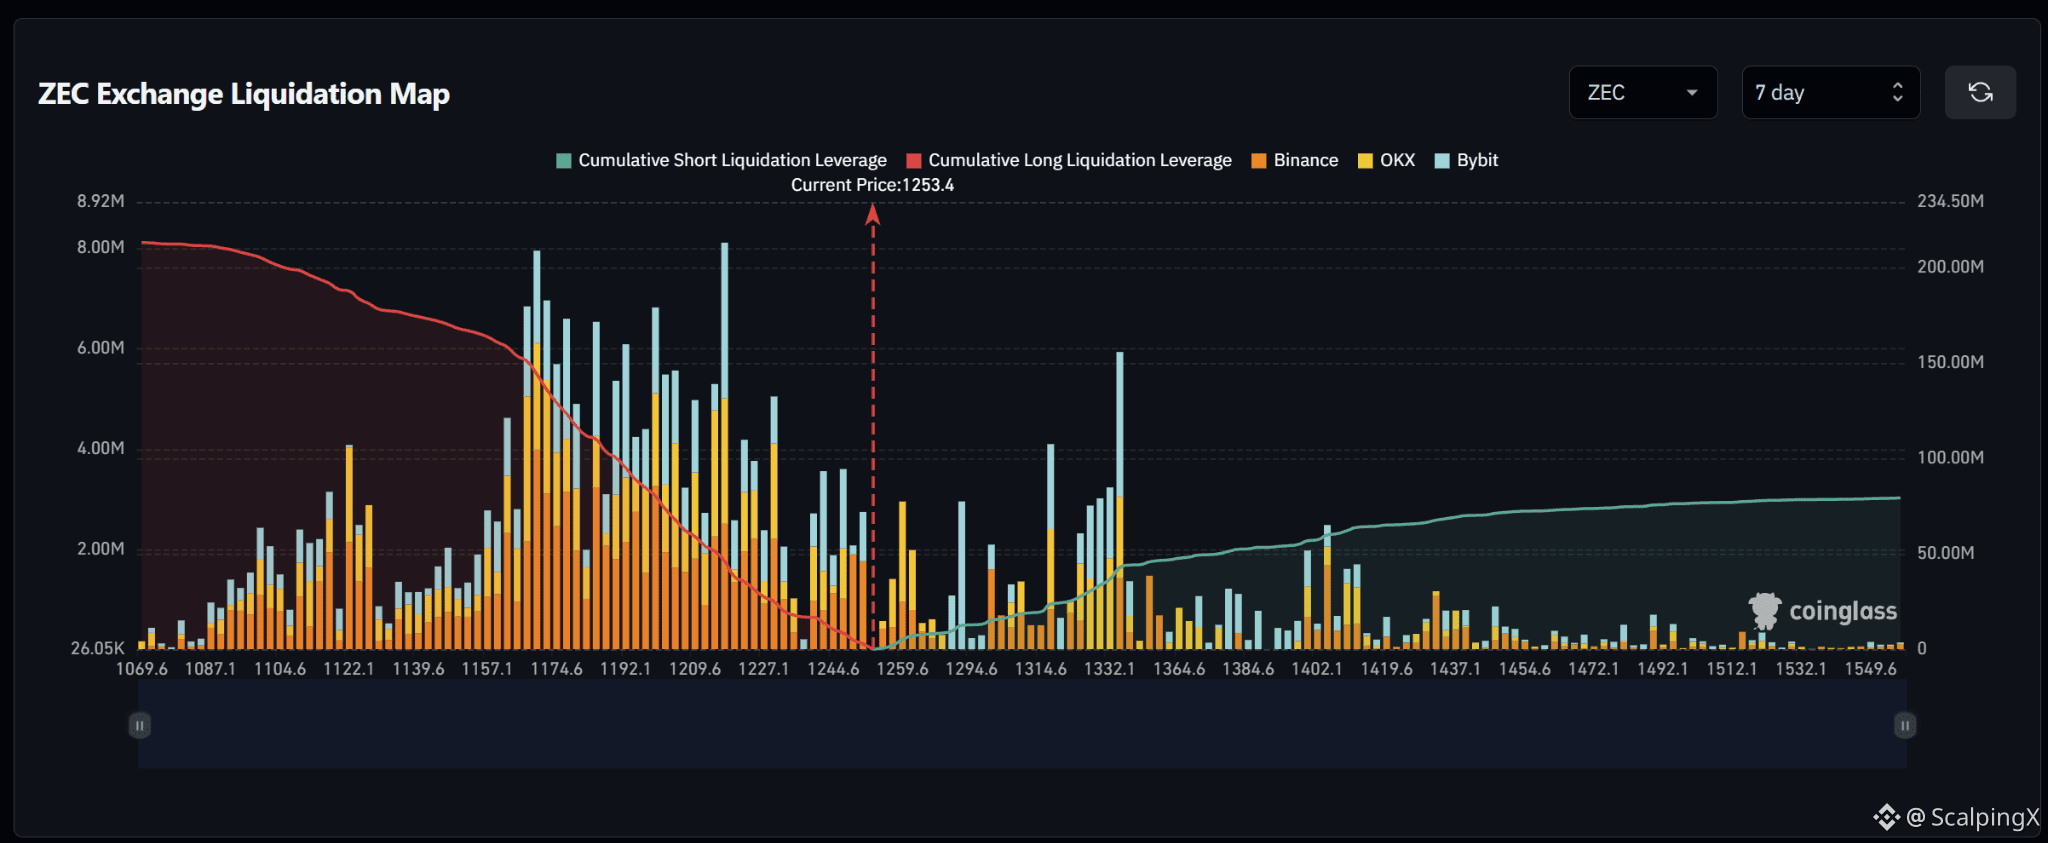
$ZEC – Liquidation Map (7 days) – Index ~1,253.4
🧭 ZEC clearly favors a downside long sweep. Estimated cumulative long liquidations reach roughly $210M versus nearly $80M in shorts across the displayed range. Successive large clusters at 1,165–1,230 create cascade risk if price falls into that band.
🔻 The first target is 1,240–1,250. Losing 1,240 without a reclaim shifts attention to 1,220–1,230, featuring one of the map’s largest liquidation spikes near 1,220.
🎯 A break below 1,220 opens targets at 1,190–1,210, then 1,165–1,180. However, sweeping the 1,220 cluster and reclaiming 1,230 would weaken further downside expectations; avoid chasing after a sharp liquidation move.
⚖️ A break and hold above 1,295 weakens the downside priority and shifts attention to shorts at 1,315–1,335. Density drops beyond this zone before another cluster around 1,400–1,415, so an extended squeeze should not be assumed.
#LiquidationMap