

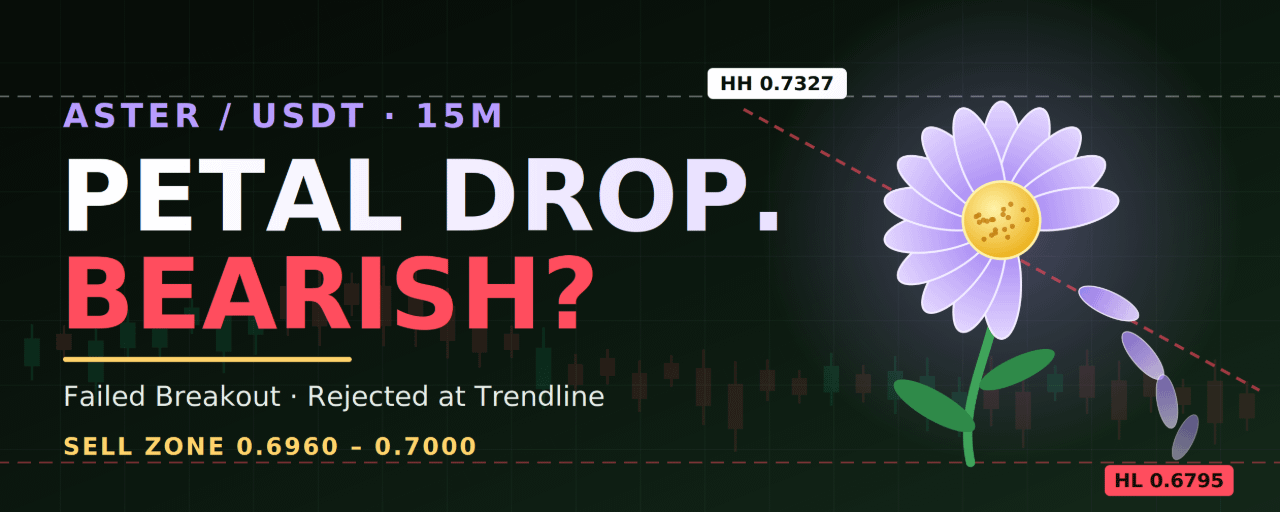


Chart: ASTER/USDT Perpetual, 15m, Binance. Last price 0.6905 (−0.32%). Time: Oct 29, 21:52 UTC.
What the chart shows
ASTER spent the morning in a tight base around 0.696–0.700, then broke out and rallied to a high near 0.7327 by about 15:30 UTC. That breakout failed. Price rolled over, lost the descending trendline drawn from the high, and at about 20:45 UTC dumped in one large candle to a low near 0.680.
Pattern: a failed breakout, or bull trap. Price took the highs, then reversed through the entire range.
Base broken: the labelled “HL” at 0.680 actually sits below the 0.696–0.698 pre-rally base, so the whole rally has been erased and then some.
Descending trendline: price was rejected at this line before the dump and has stayed under it.
Fib levels: measured from the 0.7327 high to the 0.680 low, retracement levels sit at about 0.7125 (38.2%), 0.7062 (50%) and 0.7000 (61.8%). Price at 0.6905 is below all of them.
Bearish FVGs: the dump left a supply gap at about 0.6962–0.7081, with another around 0.7154–0.7173. The bounce so far stalled at about 0.697, right at the bottom of that gap.
Price now sits in the lower third of the marked range, which runs from about 0.6795 to 0.7327.
What’s holding the bears back
The 0.680 area is the lower edge of the range. A sharp wick there shows buyers stepped in.
Selling at 0.6905 means shorting right above support, which is poor risk/reward.
The bounce candles are small, so there is no strong sign yet that sellers are still pressing.
Trade plan
Setup A: short a rebound (preferred)
Entry zone: 0.6960–0.7000, the bearish FVG base plus the 61.8% retracement and the trendline
Stop loss: 0.7085, above the FVG top and the 50% level
TP1: 0.6850
TP2: 0.6800, the swing low
TP3: 0.6710
TP4: 0.6610
Setup B: breakdown short
Trigger: a 15m candle close below 0.6795, then a failed retest from below
Entry: 0.6780–0.6795
Stop loss: 0.6860
Targets: 0.6710, then 0.6660, then 0.6610
Setup C: aggressive long bounce (counter-trend, quick scalp)
Entry: 0.6805–0.6830, only after a bullish 15m candle at support
Stop loss: 0.6765
Targets: 0.6965, then 0.7000, then 0.7062
Measured from a 0.6980 entry to the 0.7085 stop, Setup A pays about 1.2R at TP1, 1.7R at TP2 and 2.6R at TP3. Setup C pays about 2.6R to its first target, but it fights the short-term trend. After TP1, move the stop to breakeven.
What invalidates the bearish idea
A 15m close above 0.7085 means buyers reclaimed the supply gap and the 50% level.
A close above 0.7125 (the 38.2% level), especially with a break of the descending trendline, flips the bias back to neutral.
A strong hold at 0.680 with higher lows and a close back above 0.7000 would show the dump was a shakeout.
Live cross-check
My search for a live ASTER price returned scattered, undated quotes. DEX pools showed roughly $0.65–$0.67 and CoinGecko pages showed around $0.62–$0.63, all a bit below the chart’s 0.69. I can’t tell when those quotes were taken, so I used the timestamped Binance chart price of 0.6905 as the reference. Confirm the current price on Binance before entering, because 15m levels move quickly.
Bottom line
Bearish? Yes, for now. The breakout failed and price lost its base, so the better trade is to sell a rebound into 0.6960–0.7000, or a confirmed break below 0.6795. A 15m close above 0.7085 cancels the idea.
⚠️ Disclaimer: This is not financial advice. This analysis is for educational and informational purposes only. Crypto markets are highly volatile, and you can lose your capital. Always do your own research, manage your risk, and never trade with money you can’t afford to lose.
@Binance Square Official #FedWatch #EarningsSeason #USMidtermElections #Binance #ChartSniper