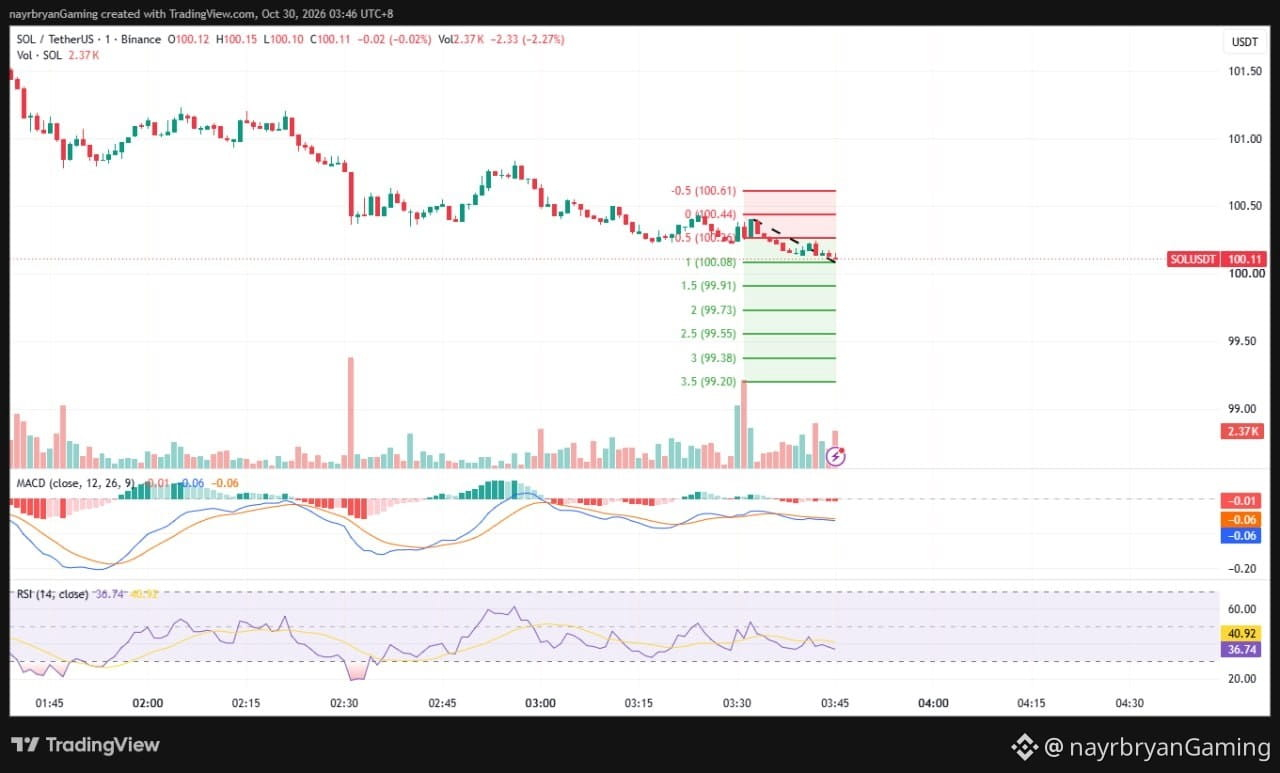
DAILY SIGNAL — SOL/USDT
Date: 30 Oct 2026
Chart Time: 03:46 UTC+8
Timeframe: 1m
Intraday Bias: Bearish continuation → downside liquidity watch
📊 MARKET BIAS
SOL is trading around 100.09 after continuing to weaken inside a descending price channel.
Price has fallen below the purple resistance zone around 100.30–100.43, which previously acted as a reaction area. The latest candles remain below this zone, suggesting that sellers retain short-term control.
The immediate technical question is whether SOL continues toward the lower Fibonacci extensions or attempts to reclaim the broken structure.
🔹 KEY LEVELS FROM CHART
Current Price: 100.09
Immediate Resistance Zone:
100.30–100.43
Upper Resistance / Invalidation Reference:
100.61
Nearest Fibonacci Level:
100.08
Major Downside Reference:
99.91
🎯 FIBONACCI LEVELS
Downside Targets:
TP1 → 100.08 (1.0 Fib)
TP2 → 99.91 (1.5 Fib)
TP3 → 99.73 (2.0 Fib)
TP4 → 99.55 (2.5 Fib)
TP5 → 99.38 (3.0 Fib)
TP6 → 99.20 (3.5 Fib)
Upside Reference Levels:
100.26 → 100.44 → 100.61
📈 TECHNICAL BREAKDOWN
1. Price Structure
SOL remains inside the descending channel drawn on the chart. Price has slipped beneath the purple zone and is trading close to the 100.08 Fibonacci level.
A sustained move below 100.08 could expose the next downside levels at 99.91 and 99.73.
🧠 QUICK INSIGHT
“Once support breaks, the next decision is whether sellers can sustain the move or buyers can reclaim the structure.”
⚠️ DISCLAIMER
This is personal chart analysis for educational purposes only, not financial advice or a guaranteed prediction.
Always DYOR / DYODD, define your risk, and avoid emotional trading.
— @nayrbryanGaming
#SOL #SOLUSDT #Crypto #Trading #TechnicalAnalysis #PriceAction #Fibonacci #Binance #DYOR #NFA #NoFOMO