$DOGE
STUCK BELOW RESISTANCE: BREAKDOWN OR BOUNCE NEXT?
◆━━━━━━━━━━━━━━━━━━◆
Market Overview
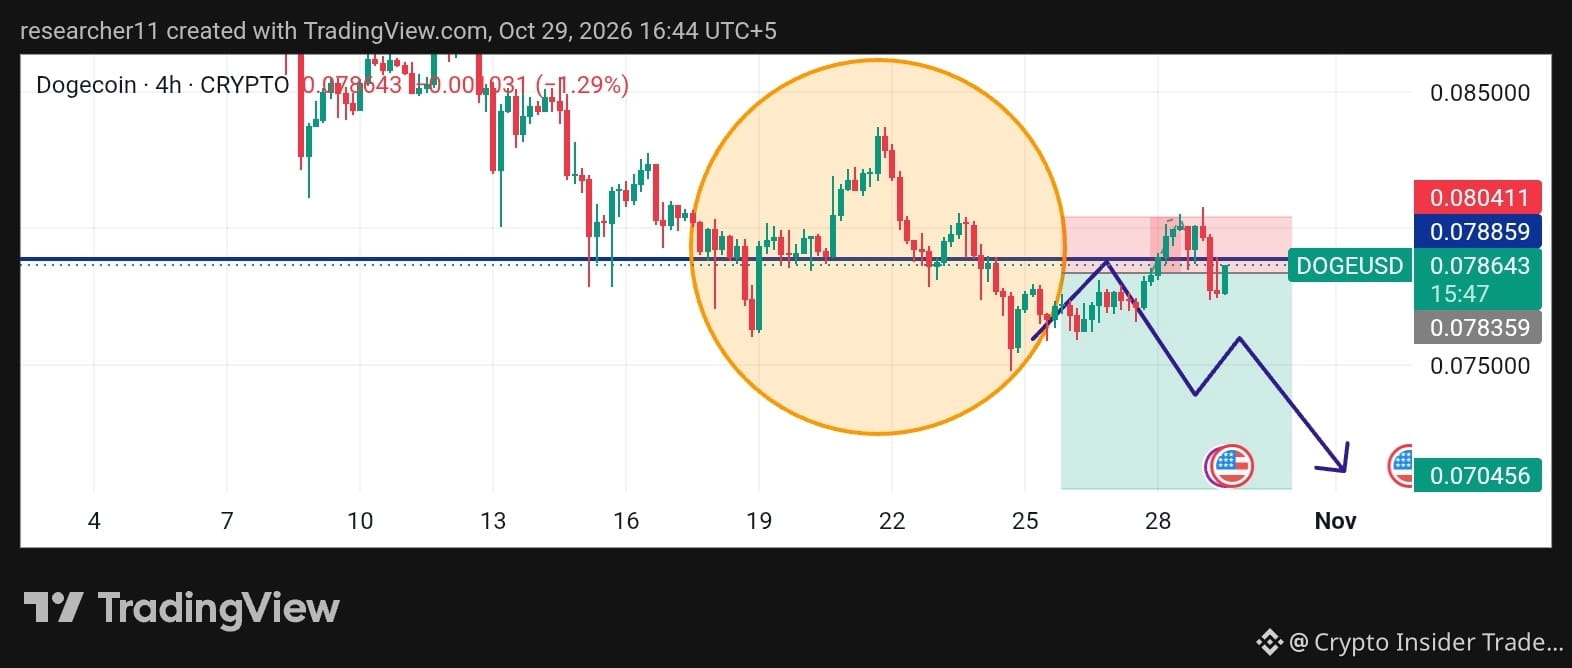
Dogecoin is trading near $0.0786, down about 1.3% on the 4H chart. After a failed attempt to push higher, DOGE is hovering just under a key resistance line. Volatility is moderate, but momentum remains weak.
Technical Analysis
DOGE spent several sessions consolidating in a wide range, marked by the highlighted zone on the chart. After peaking near Oct 22, price formed lower highs and slipped back toward the range lows.
The recent bounce stalled at $0.0788, where a horizontal level lines up with a red rejection candle near $0.0804. This shows sellers are still active. A possible path is a lower high, a dip toward $0.075, a small bounce, and then another leg down if support breaks.
🟢 Bullish Case
A 4H close above $0.0804 would show buyers taking control and could target the upper range near $0.083-$0.085.
🔴 Bearish Case
Rejection at $0.0788 followed by a break below $0.0750 could open the way toward $0.0705.
⚪ Neutral Case
DOGE may keep ranging between $0.0750 and $0.0788 until volume returns.
Key Levels
➤ Resistance: R1 $0.0788 | R2 $0.0804
➤ Support: S1 $0.0750 | S2 $0.0705
Market Context
DOGE is sentiment-driven and often reacts quickly to BTC moves. Sudden volatility is possible.
Conclusion
The $0.0788-$0.0804 zone is the line in the sand. Watch for a breakout or another rejection, and let confirmation lead the way.
This is not financial advice. Always do your own research.
◆━━━━━━━━━━━━━━━━━━◆
#FedWatch #DOGE #Nasdaq100FuturesFall0.9% #EarningsSeason #CanGoogleDefindItsCore