$BTC
HITS A HEAVY RESISTANCE WALL: IS A DEEPER PULLBACK BREWING?
◆━━━━━━━━━━━━━━━━━━◆
Market Overview
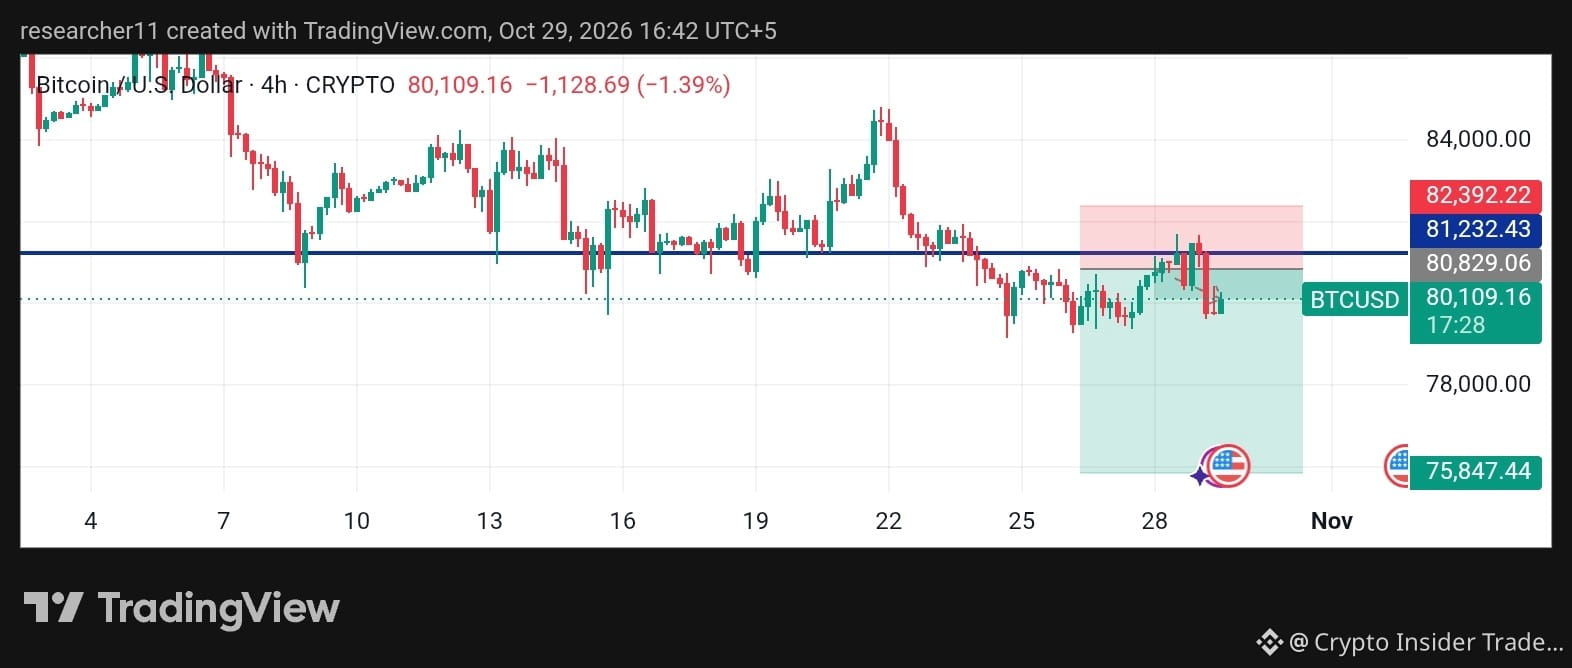
Bitcoin is trading near $80,100, down about 1.4% on the 4H chart. After the sharp rejection from the $85,000 area on Oct 22, price has printed lower highs, and recent bounces keep fading. Momentum is leaning bearish while volatility stays elevated.
Technical Analysis
BTC was rejected near the $81,200 horizontal zone, an area that used to act as support and now looks like resistance. The latest push toward $82,000 was met with a strong red 4H candle, a typical sign that sellers are defending this level.
The structure shows lower highs and lower lows. While price stays below $81,200, the short-term bias remains cautious. Buyers need a clear 4H close above this zone, backed by volume, to change the picture.
🟢 Bullish Case
A 4H close above $81,200 and a hold above $82,400 would show buyers regaining control, with room toward the $85,000 swing high.
🔴 Bearish Case
Failure to reclaim $81,200, followed by a break below $78,000, could open a slide toward the $75,800 area.
⚪ Neutral Case
Price may chop between $78,000 and $81,200 while the market waits for a fresh catalyst.
Key Levels
➤ Resistance: R1 $81,200 | R2 $82,400
➤ Support: S1 $78,000 | S2 $75,850
Market Context
Bitcoin leads the market. When BTC struggles at resistance, altcoins often feel the pressure too, so watch its reaction closely.
Conclusion
All eyes are on the $81,200 zone. A rejection keeps sellers in charge, while a confirmed breakout shifts momentum. Let price confirm before assuming direction.
This is not financial advice. Always do your own research.
◆━━━━━━━━━━━━━━━━━━◆
#FedWatch #EarningsSeason #BTC #Nasdaq100FuturesFall0.9% #BitcoinCore32.1RaisesPeerConnectionLimit