

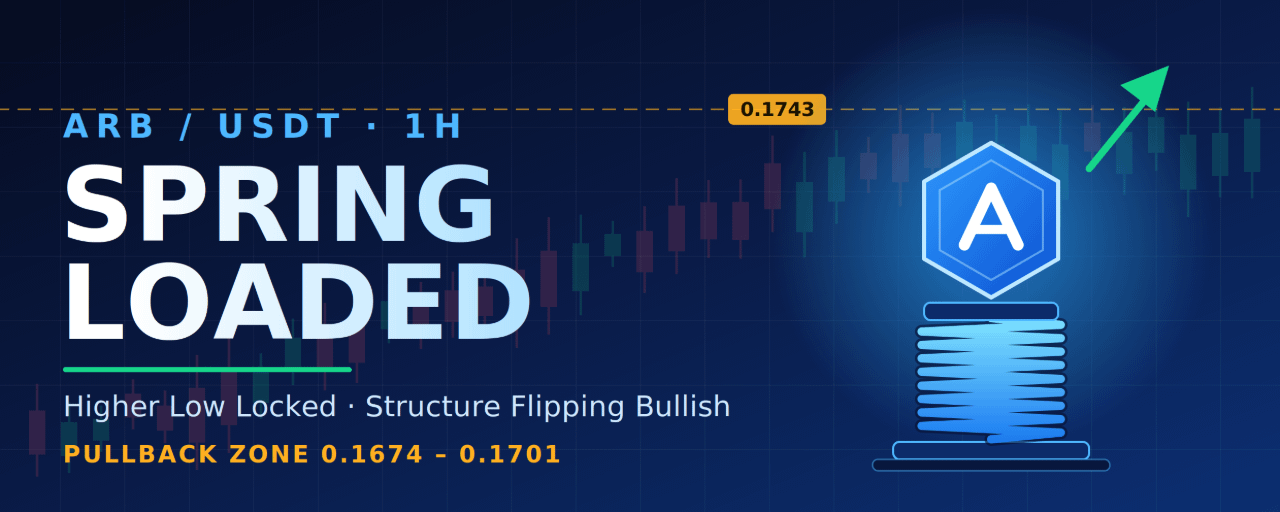


Chart: ARB/USDT, 1H, Binance. Last price 0.1732 (+0.87%).
Short answer: cautiously bullish. ARB has just broken its short-term downtrend structure, and the next move depends on whether the pullback holds.
What the chart shows
From October 23 to 28, ARB made a clear series of lower highs and lower lows. The sellers were in control, and price slid from around 0.186 into the 0.163 area.
That changed on October 28. Price printed a Higher Low near 0.1633, then ran hard into a Higher High at 0.1743, just above the previous Lower High (~0.173). A small break, but it is the first higher high after a week of lower ones, and that is a real shift in structure.
Three things back it up:
Trendline support: the rising white line from the Higher Low is holding. Price is trading above it.
Bullish FVG: the impulse left a fair value gap between roughly 0.1672 and 0.1714, which is a likely demand zone on any dip.
Fib confluence: measured from the 0.1743 high to the 0.1633 low, the retracement levels line up with that gap. The 38.2% sits near 0.1701, the 50% near 0.1688 and the 61.8% near 0.1674.
The caution
This is one impulse leg on the 1H chart, not a confirmed trend reversal. Overhead there are untested bearish FVG zones around 0.1770–0.1800 and 0.1860. Price also sits right at the 0.1743 high, and chasing a green candle into resistance is how late buyers get trapped. The better entry is on a pullback or a confirmed break, not here.
Trade plan (long bias)
Setup A: pullback entry (preferred)
Entry zone: 0.1688–0.1701 (38.2%–50% retracement, inside the FVG)
Stop loss: 0.1660, below the 61.8% level and the base of the FVG
TP1: 0.1743 (the Higher High)
TP2: 0.1780
TP3: 0.1820
Extended target: 0.1860 if momentum carries
Setup B: breakout entry
Entry: a 1H candle close above 0.1745, ideally with a retest of 0.1743 as support
Stop loss: 0.1712, below the retest zone
Targets: 0.1780, then 0.1820, then 0.1860
Measured from the midpoint of the entry zone (0.1695) to the 0.1660 stop, TP1 pays roughly 1.4R and TP2 roughly 2.4R. After TP1, consider moving the stop to breakeven.
What invalidates the idea
A 1H close below 0.1660 means the fib support and the FVG failed. Stand aside.
A break of the 0.1633 Higher Low puts the downtrend back in control, and lower lows become likely.
If price breaks the rising trendline and cannot reclaim it quickly, the bounce was probably just a relief move.
Live chart cross-check
I searched for a live ARB price, but the sources returned stale or inconsistent figures, anywhere from about $0.08 to $0.59 depending on the site and date, and none matched this chart. I treated the timestamped Binance chart price of 0.1732 as the reference. Before entering, confirm the current price on Binance. If it has already moved well away from the levels above, adjust the plan.
Bottom line
Bullish, but conditional. ARB has put in a Higher Low and a Higher High, with trendline and FVG support underneath. The cleanest trade is a patient pullback into 0.1688–0.1701, or a confirmed close above 0.1745. A 1H close below 0.1660 cancels the setup.
⚠️ Disclaimer: This is not financial advice. This analysis is for educational and informational purposes only. Crypto markets are highly volatile, and you can lose your capital. Always do your own research, manage your risk, and never trade with money you can’t afford to lose.
@Binance Square Official #CanMicrosoftDeliverOnAI #CanGoogleDefindItsCore #EarningsSeason #Binance #ChartSniper