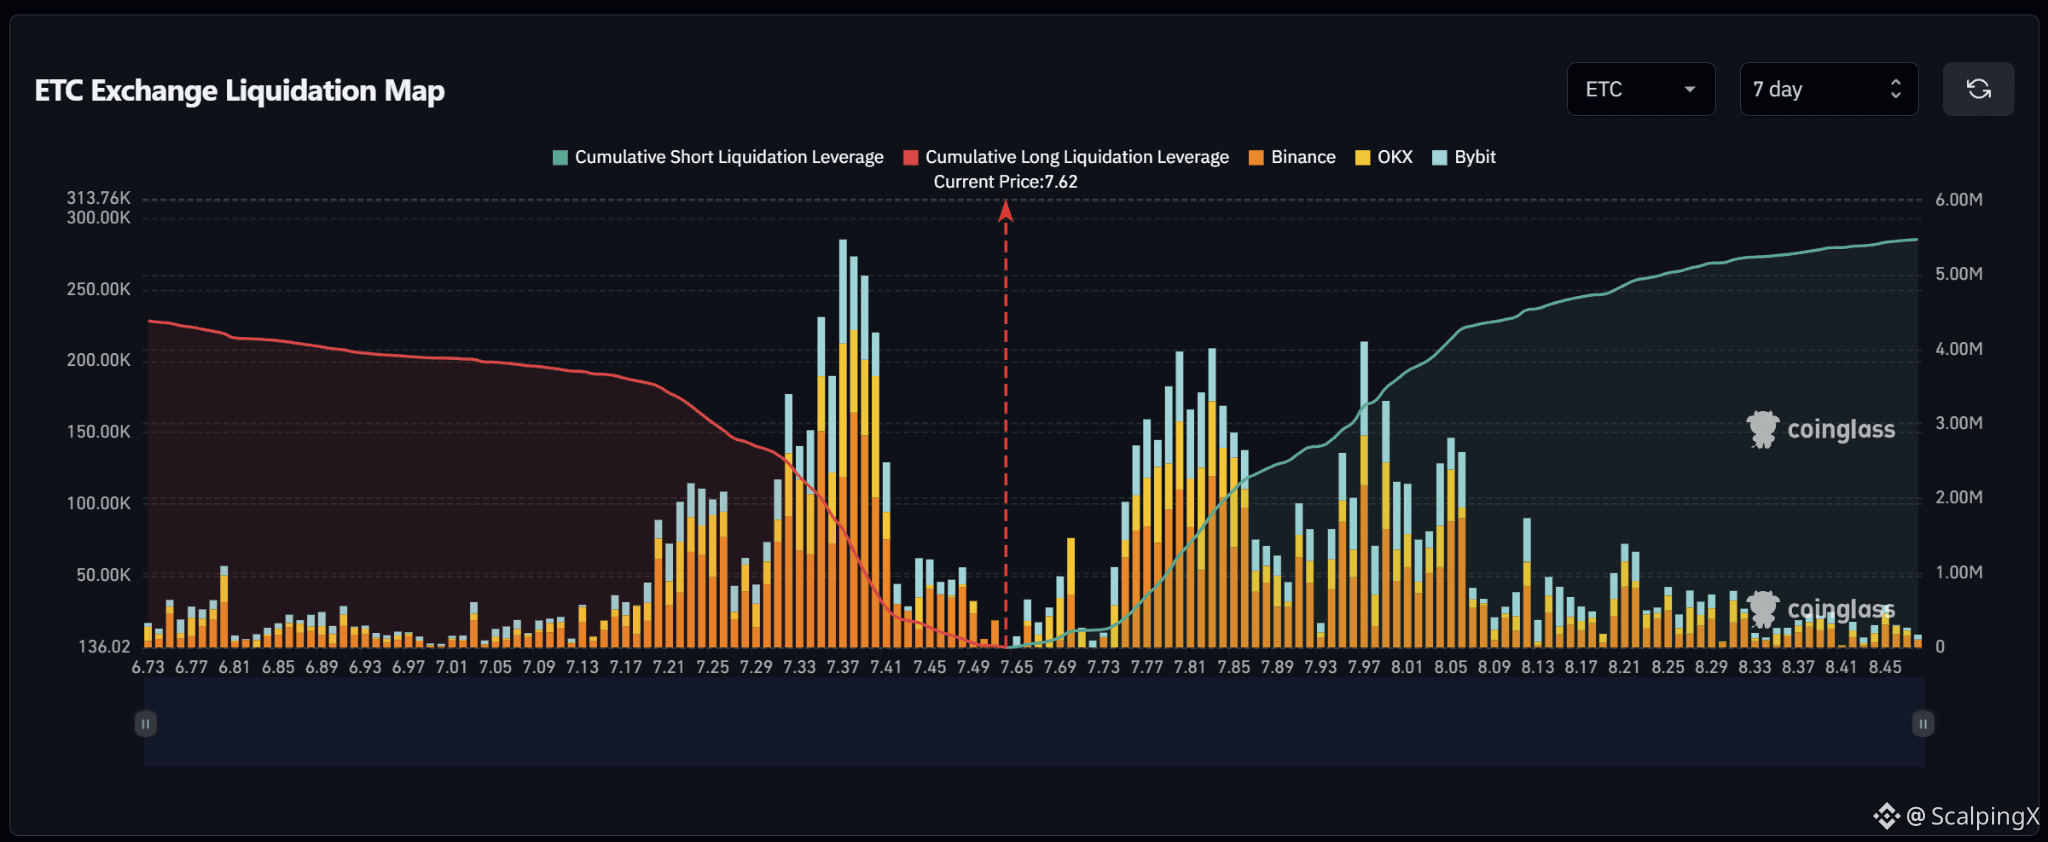
$ETC – Liquidation Map (7 days) – Index ~7.62
🧭 ETC favors an upside short sweep first. The 7.75–7.85 cluster sits closer to price than the heavy long concentration at 7.33–7.41, with another notable short band following at 7.95–8.06.
🔺 Liquidation density is relatively thin across 7.65–7.73. The main nearby target is 7.75–7.85, particularly around 7.80 and 7.83. Short liquidations there could amplify the advance as price enters the zone.
🎯 A break and hold above 7.85 shifts attention to 7.95–8.06.
Density drops noticeably beyond that band, making the reaction after a sweep more important than chasing farther targets.
⚖️ Losing 7.49 without a reclaim weakens the upside bias and shifts attention to the long cluster at 7.33–7.41, particularly 7.37–7.39. A sweep of 7.80–7.85 followed by a drop below 7.75 would also weaken expectations for continuation.
#LiquidationMap