🚨 SOLANA (SOL/USDT): A Critical Support Zone to Watch! 📉📈
🔥 Will SOL Bounce Back or Break Down?
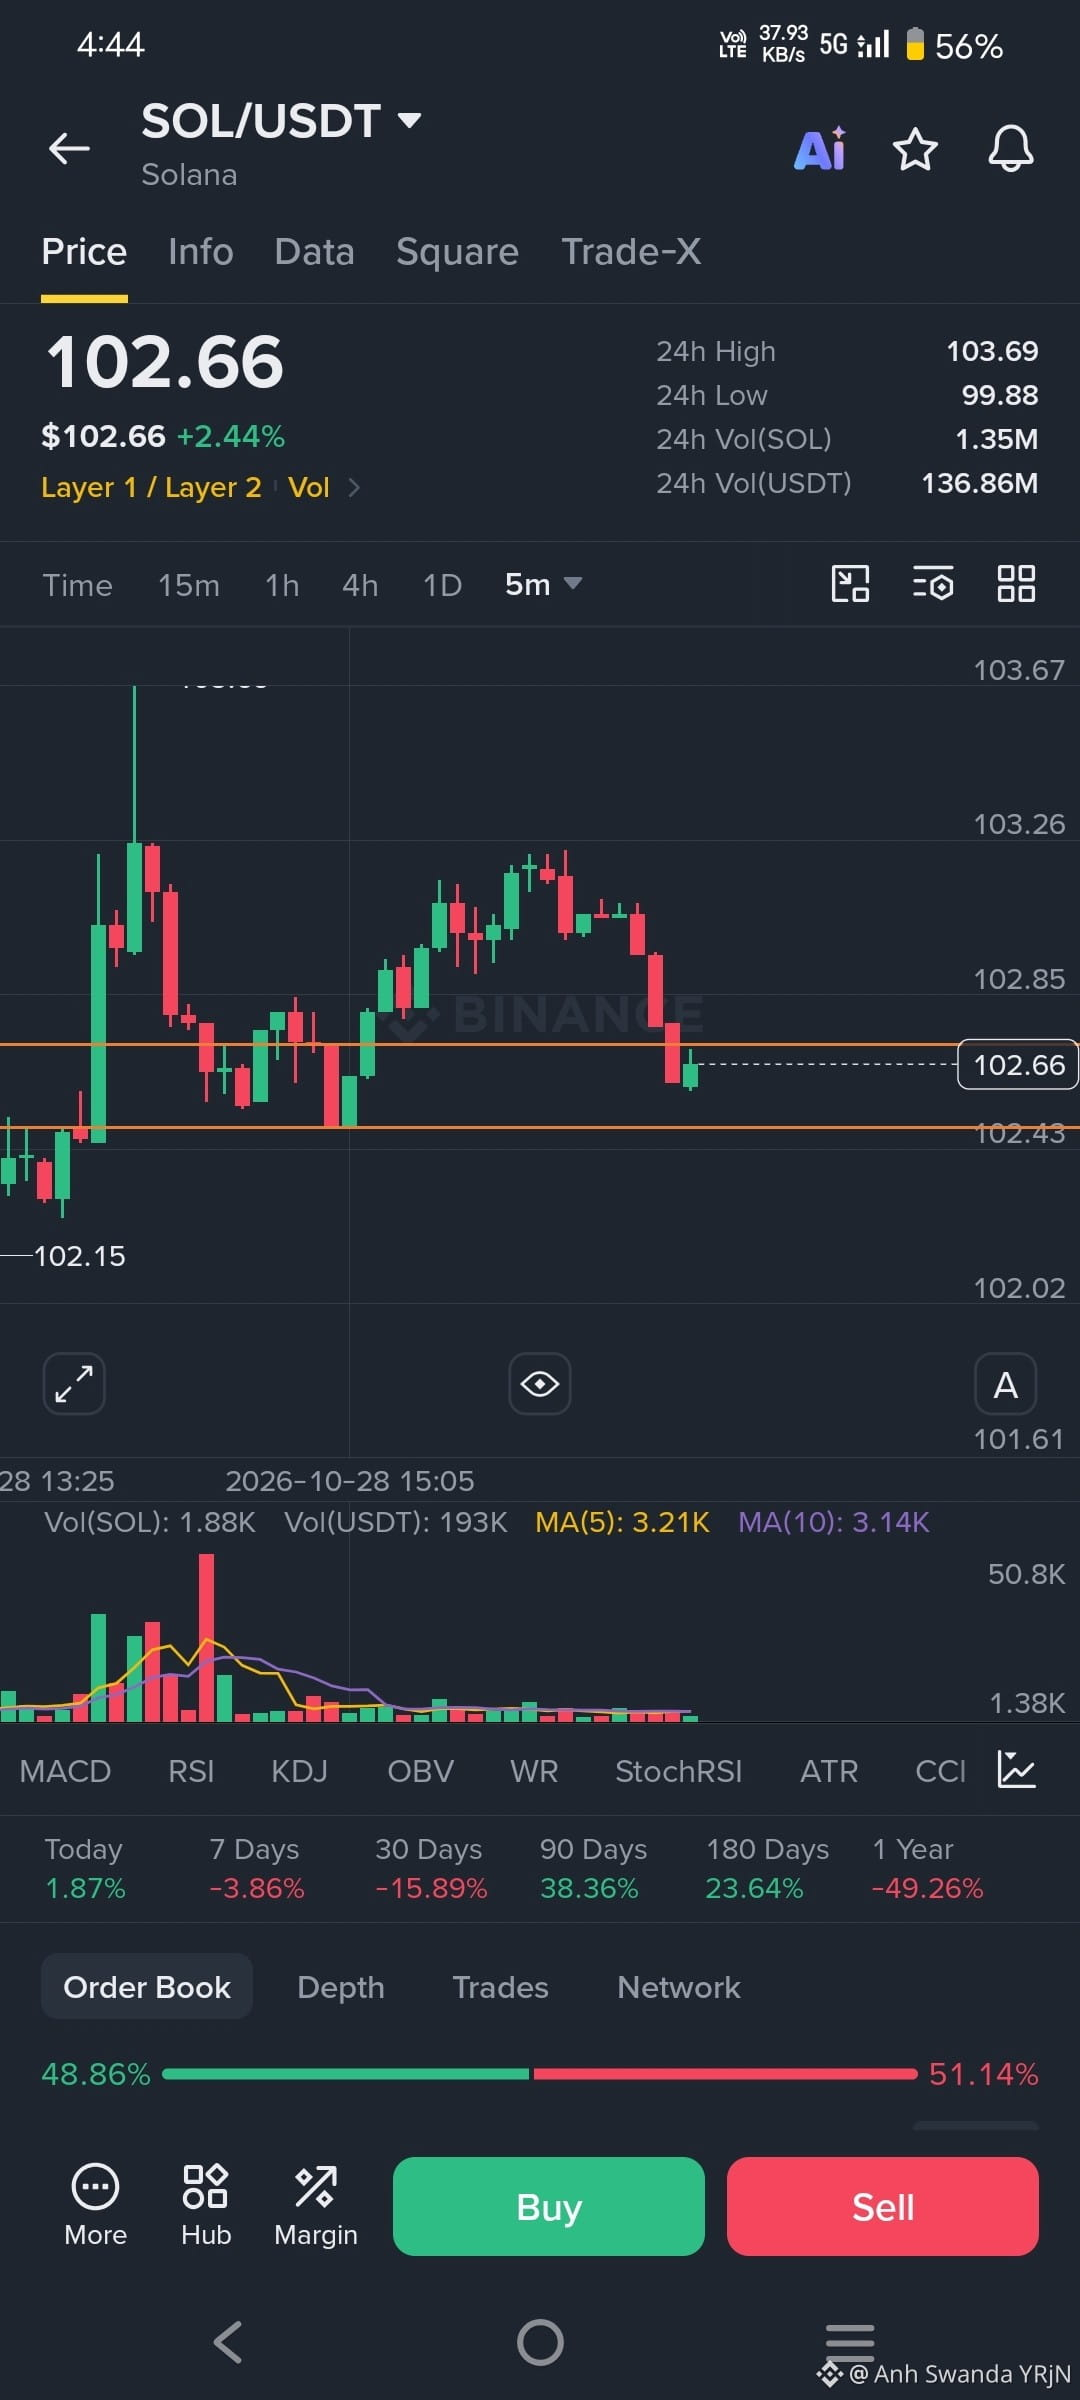
Solana is showing an interesting price movement on the 5-minute chart. After facing selling pressure near the $103.00–$103.20 region, SOL has pulled back toward an important support area around $102.43–$102.50.
Now, the big question is: Will buyers defend this zone, or will sellers push the price lower? 👀
📊 🔍 Technical Analysis
🟢 Support Zone: $102.43–$102.50
🔴 Resistance Zone: $102.85–$103.00
⚡ Current Price in the Screenshot: $102.66
📈 Bullish Scenario:
If SOL holds the support zone and forms a strong bullish reversal with increasing volume, buyers could attempt to push the price toward $102.85 and potentially $103.00.
📉 Bearish Scenario:
If the support zone breaks decisively and price confirms below it, further downside movement may follow. Watch for a possible retest before considering any trade.
🧠 My Trading Approach
I would watch price action, volume, and candle confirmation before making a decision. A support level alone is not a buy signal, and a breakdown is not confirmed until price action supports it.
💬 What do you think?
👇 Will SOL bounce from $102.43, or break below support?
Share your analysis in the comments! Let's learn, analyze, and trade responsibly together. 🚀
⚠️ Risk Disclaimer: This is a technical observation based on the chart screenshot, not a guaranteed prediction or financial advice. Crypto markets are volatile. Always do your own research and manage your risk.
#Solana #SOLUSDT #BinanceSquare #CryptoAnalysis #TechnicalAnalysis #CryptoTrading #priceaction $SOL $SOL