
By DOCTOR_SIGNaLs | Crypto Education • Technical Analysis • Trading Psychology
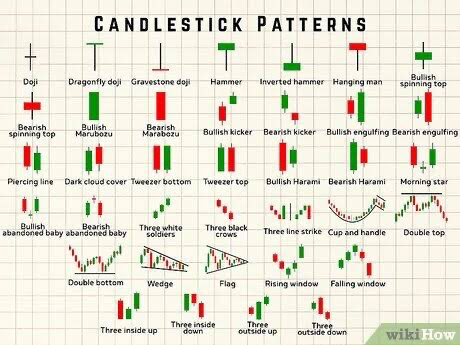
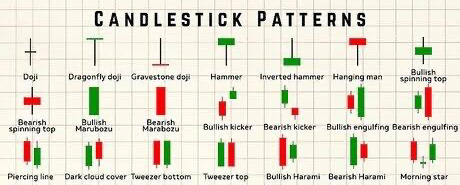
Want to understand what candlesticks are telling you about the market? This guide explains all 37 patterns shown in the reference chart, what they can indicate, where they are most useful, and how crypto traders can confirm potential setups.
Remember: A pattern is a trading clue, not a guaranteed prediction. Context matters more than the shape alone.
🟢 PART 1: SINGLE-CANDLE PATTERNS
1. Doji
A Doji forms when the opening and closing prices are nearly equal. It reflects indecision between buyers and sellers.
Possible signal: A pause or potential reversal, especially after a strong move.
Trading tip: Wait for the next candle to confirm direction. A Doji alone is not automatically bullish or bearish.
2. Dragonfly Doji
This candle has a long lower shadow, with the open, close, and high near the same level.
Possible signal: Buyers rejected lower prices, potentially indicating bullish pressure after a decline.
Confirmation: Look for a bullish follow-through candle or a break above nearby resistance.
3. Gravestone Doji
This candle has a long upper shadow, with the open, close, and low near the same level.
Possible signal: Buyers pushed prices higher, but sellers forced the price back down. It may warn of bearish pressure after an uptrend.
Confirmation: Watch for a bearish candle or a break below nearby support.
4. Hammer
A Hammer has a small real body near the top and a long lower shadow. It commonly appears after a decline.
Possible signal: Sellers pushed the price lower, but buyers recovered much of the move.
Confirmation: A bullish candle following the Hammer can strengthen the reversal idea.
5. Inverted Hammer
An Inverted Hammer has a small body near the bottom and a long upper shadow. It may appear after a downtrend.
Possible signal: Buyers attempted to push the price higher. This may be an early sign of a potential bullish reversal.
Confirmation: Look for a strong bullish candle afterward. The upper shadow alone does not prove that buyers are in control.
6. Hanging Man
The Hanging Man resembles a Hammer but appears after an uptrend.
Possible signal: Selling pressure emerged during the session, potentially warning that the uptrend is weakening.
Confirmation: A bearish follow-through candle or a break below support makes the warning more meaningful.
7. Bullish Spinning Top
A Spinning Top has a small real body and shadows on both sides. When it appears after a decline, it may indicate that selling momentum is weakening.
Possible signal: Market indecision and a possible change in momentum.
Confirmation: Wait for a bullish breakout or follow-through candle.
8. Bearish Spinning Top
This candle also has a small body and shadows on both sides, but it appears after an advance.
Possible signal: Buyers may be losing momentum, although the candle itself is neutral.
Confirmation: Look for bearish follow-through or a break below support.
🔴 PART 2: STRONG CANDLE & TWO-CANDLE PATTERNS
9. Bullish Marubozu
A bullish Marubozu is a large bullish candle with little or no shadow.
Possible signal: Buyers controlled most or all of the candle’s trading range.
Trading tip: A breakout above resistance with strong volume can add confirmation. Avoid chasing a candle that has already moved too far.
10. Bearish Marubozu
A bearish Marubozu is a large bearish candle with little or no shadow.
Possible signal: Sellers controlled the session and may be driving downward momentum.
Trading tip: Check whether support has broken and whether the move is supported by volume.
11. Bullish Kicker
A Bullish Kicker is a sharp shift from bearish to bullish price action, traditionally involving a gap between candles.
Possible signal: A sudden change in sentiment in favor of buyers.
Confirmation: Look for strong bullish follow-through. Classic gaps are less common in continuously traded crypto markets, so not every sharp reversal qualifies as a textbook Kicker.
12. Bearish Kicker
A Bearish Kicker is a sharp shift from bullish to bearish price action, traditionally accompanied by a gap.
Possible signal: A sudden change in sentiment in favor of sellers.
Confirmation: Watch for continued selling and a break below support.
13. Bullish Engulfing
A small bearish candle is followed by a bullish candle whose real body engulfs the previous real body.
Possible signal: Buyers have overcome the previous candle’s selling pressure.
Best context: After a decline or near a meaningful support zone.
Confirmation: A close above nearby resistance can strengthen the setup.
14. Bearish Engulfing
A small bullish candle is followed by a bearish candle whose real body engulfs the previous real body.
Possible signal: Sellers have overwhelmed the previous candle’s buying pressure.
Best context: After an uptrend or near resistance.
Confirmation: Look for a support break or continued bearish price action.
15. Piercing Line
This bullish two-candle pattern occurs after a decline. A bearish candle is followed by a bullish candle that closes above the midpoint of the previous candle’s real body, while generally remaining below its open.
Possible signal: Buyers are recovering ground and a bullish reversal may be developing.
Confirmation: A break above nearby resistance adds strength.
16. Dark Cloud Cover
This bearish pattern appears after an advance. A bullish candle is followed by a bearish candle that closes below the midpoint of the previous candle’s real body, while generally opening above the previous close.
Possible signal: Sellers are gaining control after an upward move.
Confirmation: Look for bearish follow-through or a support break.
17. Tweezer Bottom
Two candles form lows around approximately the same price level following a decline.
Possible signal: The market may be rejecting a support zone.
Confirmation: A bullish candle or breakout above the pattern’s short-term high can help confirm the idea.
18. Tweezer Top
Two candles form highs around approximately the same price level after an advance.
Possible signal: Resistance may be holding, and a bearish reversal could develop.
Confirmation: Look for a bearish follow-through candle or a break below short-term support.
19. Bullish Harami
A large bearish candle is followed by a smaller candle whose real body fits inside the previous bearish real body.
Possible signal: Selling momentum may be slowing.
Confirmation: A bullish breakout above the smaller candle’s high can improve confidence.
20. Bearish Harami
A large bullish candle is followed by a smaller candle whose real body fits inside the previous bullish real body.
Possible signal: Buying momentum may be weakening.
Confirmation: A bearish break below the smaller candle’s low can strengthen the bearish interpretation.
21. Morning Star
This three-candle bullish reversal pattern usually consists of a large bearish candle, a small-bodied candle showing indecision, and a strong bullish candle that closes well into the first candle’s body.
Possible signal: Selling pressure may be giving way to buying pressure.
Best context: After a sustained decline, especially near support.
Confirmation: Look for follow-through above the third candle’s high.
🟢 PART 3: MULTI-CANDLE REVERSAL & CONTINUATION PATTERNS
22. Bullish Abandoned Baby
This rare three-candle bullish reversal pattern consists of a bearish candle, a Doji separated by a gap, and a bullish candle separated from the Doji by another gap.
Possible signal: A sharp shift from selling to buying pressure.
Important: True gaps are essential to the traditional pattern and are relatively uncommon in 24/7 crypto markets.
23. Bearish Abandoned Baby
This rare bearish reversal pattern consists of a bullish candle, a separated Doji, and a bearish candle separated from the Doji by another gap.
Possible signal: A potential shift from buying pressure to selling pressure.
Confirmation: Look for bearish follow-through and a break below support.
24. Three White Soldiers
Three consecutive strong bullish candles typically appear after a decline. Each candle generally closes higher than the previous one, with openings inside or near the preceding real body.
Possible signal: Buyers are building sustained momentum.
Caution: If the pattern appears after an already extended rally, the market may be overbought or due for a pullback.
25. Three Black Crows
Three consecutive strong bearish candles typically appear after an advance. Each generally closes lower than the previous one.
Possible signal: Sellers are building sustained momentum.
Confirmation: A break below support may support the bearish continuation or reversal idea.
26. Three Line Strike
In a common bullish interpretation, three bearish candles are followed by a large bullish candle that reverses the preceding three-candle move. The bearish version is the opposite: three bullish candles followed by a large bearish candle.
Possible signal: A sharp counter-move that may indicate continuation of the earlier trend in some traditional interpretations.
Important: Three Line Strike has different interpretations across trading references. Check the direction of the preceding trend and wait for confirmation rather than treating the pattern as an automatic reversal.
27. Three Inside Up
This bullish three-candle pattern begins with a large bearish candle, followed by a smaller bullish candle contained within its real body, and then a bullish candle that closes above the first candle’s open.
Possible signal: Selling momentum may be turning into buying momentum.
Confirmation: A break above the first candle’s high offers additional evidence.
28. Three Inside Down
This bearish pattern begins with a large bullish candle, followed by a smaller bearish candle contained within its real body, and then a bearish candle that closes below the first candle’s open.
Possible signal: Buying momentum may be turning into selling momentum.
Confirmation: Watch for a break below the first candle’s low.
29. Three Outside Up
This bullish pattern starts with a bearish candle, followed by a bullish Engulfing candle, and then another bullish candle that confirms the reversal.
Possible signal: Buyers may be taking control after a decline.
Confirmation: A sustained move above nearby resistance can support the setup.
30. Three Outside Down
This bearish pattern starts with a bullish candle, followed by a bearish Engulfing candle, and then another bearish candle confirming the move.
Possible signal: Sellers may be taking control after an advance.
Confirmation: Look for continued weakness and a break below support.
📈 PART 4: CHART PATTERNS
These formations use multiple candles and price swings rather than a single candle shape.
31. Cup and Handle
The Cup and Handle is a bullish continuation pattern in many technical-analysis approaches. Price forms a rounded, cup-like recovery, then consolidates in a smaller handle before potentially breaking above resistance.
Possible signal: A bullish breakout if price clears the cup’s resistance area.
Trading approach: Wait for a confirmed breakout; some traders also look for a successful retest of resistance.
Risk: Failed breakouts can reverse quickly.
32. Double Top
A Double Top forms when price tests a similar resistance level twice and fails to break through.
Possible signal: Potential bearish reversal, particularly after an uptrend.
Confirmation: The traditional confirmation is a break below the neckline—the support level between the two peaks.
Risk management: Resistance alone is not confirmation; price may still break upward.
33. Double Bottom
A Double Bottom forms when price tests a similar support level twice and rebounds
Possible signal: Potential bullish reversal after a decline.
Confirmation: Traders commonly watch for a break above the neckline, the resistance between the two lows.
Risk management: If support breaks decisively, the bullish setup may fail.
34. Wedge
A Wedge forms when price swings converge between two sloping trendlines.
Rising wedge: Often considered bearish, especially if it develops after an advance.
Falling wedge: Often considered bullish, especially after a decline.
Confirmation: Wait for a breakout from the wedge and assess whether volume and subsequent candles support the move. Wedges do not always break in the expected direction.
35. Flag
A Flag forms when a strong price move is followed by a short consolidation, often inside a small channel.
Bullish flag: A strong upward move followed by a pause or pullback.
Bearish flag: A strong downward move followed by a pause or rebound.
Possible signal: Continuation in the direction of the initial move.
Confirmation: Watch for a breakout from the flag in the direction of the preceding trend.
36. Rising Window
A Rising Window is a bullish gap between one candle’s high and the next candle’s low.
Possible signal: Strong upward momentum, sometimes acting as a support zone.
Crypto note: Since crypto trades continuously, textbook gaps are less common than in markets with fixed opening hours. Low-liquidity periods or exchange-specific charts can still show gaps.
37. Falling Window
A Falling Window is a bearish gap between one candle’s low and the next candle’s high.
Possible signal: Strong downward momentum, sometimes acting as resistance.
Confirmation: Watch whether price continues lower or retraces into the gap. A gap is not a guarantee of further decline.
🧠 HOW TO USE THESE PATTERNS IN CRYPTO TRADING
1. Identify the trend first.
A Hammer after a decline has a different meaning from a similar candle in the middle of a sideways market.
2. Mark support and resistance.
Patterns near important levels are often more informative than patterns appearing randomly on a chart.
3. Wait for confirmation.
A candle close, breakout, retest, or follow-through move may help distinguish a real setup from market noise.
4. Use volume and timeframe context.
Volume can help assess participation, while higher-timeframe levels may matter more than small patterns on very short charts.
5. Plan your invalidation level.
Decide in advance where the trade idea would no longer make sense. A stop-loss can help manage risk, although slippage and fast markets can affect execution.
6. Protect your capital.
Avoid risking money you cannot afford to lose. High leverage magnifies both gains and losses, and liquidation can occur quickly.
🔍 FINAL TAKEAWAY
Candlestick and chart patterns help traders organize price information and develop trading hypotheses. They are most useful when combined with trend analysis, support and resistance, confirmation, and disciplined risk management.
No pattern guarantees a profit. Test your strategy on historical data and a demo account before risking real capital.
DOCTOR_SIGNaLs — Learn the Pattern. Confirm the Setup. Manage the Risk.
Educational content only. This article is not financial advice or a guarantee of trading results. Cryptocurrency trading, especially leveraged futures, carries substantial risk.
#DOCTOR_SIGNaLs #CanMicrosoftDeliverOnAI #FOMCWatch #EarningsSeason #Candlestick