


Sample: 56 Binance-listed ERC-20 tokens, data to 26 Oct 2026
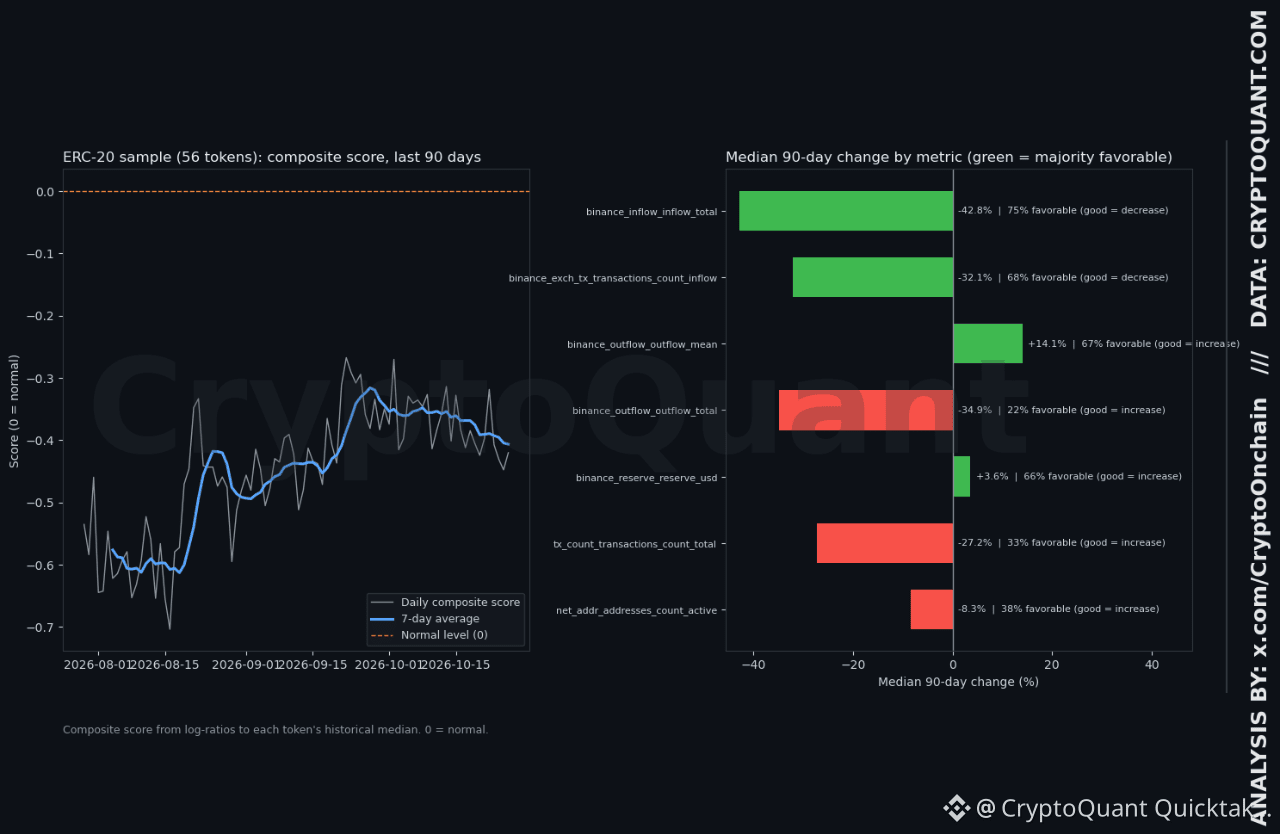
On 26 Oct 2026, the market inflow index for Binance-tagged addresses stood at 0.80 (1.00 = each token's historical median). Over 90 days, the median token-level change in total inflow was −43%, and median transaction counts fell 27%.
These figures describe this sample, not the full altcoin market. The sample's composite score was −0.41 over the last seven days (0 = normal), moving only −0.05 against the prior 30 days.
Exchange-flow metrics do not move in one direction. Average outflow per transfer rose 14%, while total outflow fell 35%. Over the same period, active addresses fell 8% and sending addresses fell 13%.
[Macro context: name the CPI, PPI, rate, or DXY event of 20–26 Oct 2026 and verify it before publishing.]
These readings may create conditions worth comparing with past periods of similar inflow and activity patterns. That comparison has not yet been run on this sample.
One candidate explanation, unverified: holders may be moving tokens to self-custody. The data do not confirm this.
Volume and burn/mint counts are excluded. The top five tokens hold 99.8% of recent volume. Binance address labels should be verified before publication.
"For now, the clearest reading is that exchange-flow metrics have improved on some measures while on-chain activity has weakened, in a sample too small to describe the wider altcoin market."
Written by CryptoOnchain