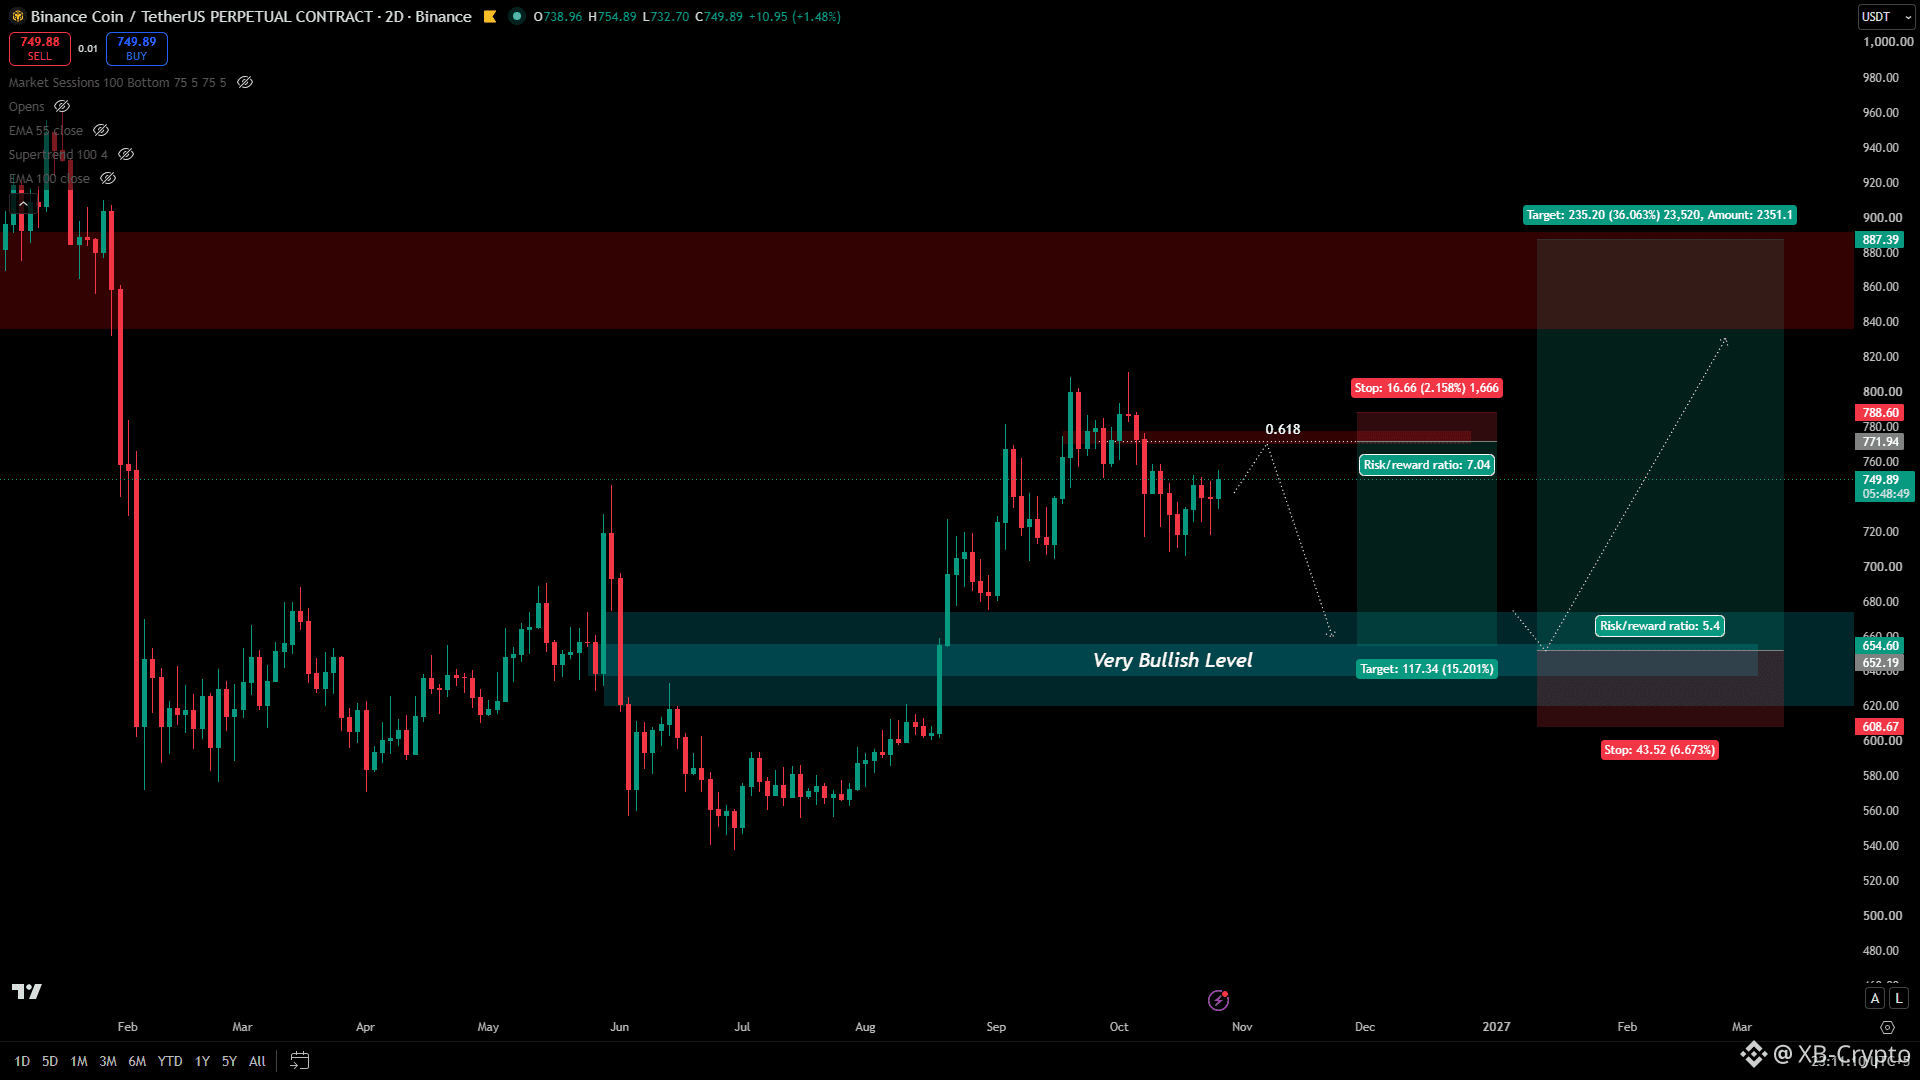
When I look at $BNB on higher timeframes, I’m not just looking for a direction. I’m looking at how price could move from one important zone to another and where the next opportunity might develop.
Right now, I have two scenarios in mind: a potential short first, followed by a long setup if price reaches a major Liquidity zone.
Here’s how I’m looking at it.
First Opportunity: A Potential Short in to the major Liquidity Zone
$BNB is currently trading around $751, below the $772–$779 area, which I’m watching as potential resistance.
This area has a 3D Breaker Block with the 0.618 Fibonacci level, making it an important zone to monitor. If price retraces into this region and shows clear rejection, I’ll consider a short position.
My main target is the $654 area, with the possibility of further downside toward $635–$620.
My short trade plan:
- Entry area: $772–$779, subject to rejection
- Target: $654
- Extended target: $635–$620
- Invalidation: Above $788.60
The idea is to capture a potential pullback rather than assume BNB will continue moving higher without a correction.
Of course, reaching the key area alone isn't enough. I want to see how price behaves there before making a decision.
Second Opportunity: A Potential Long From Major Liquidity Zone
The more interesting part of this chart, in my opinion, is the Liquidity zone between $657 and $655 which is 2D BB behind two FVG’s, inside Monthly BB behind an FVG. This area has the potential for a significant bullish reversal.
My long trade plan:
- Area of interest: $655–$635
- First target: $771–$788
- Extended target: $850–$887
- Invalidation: Below $608.67
The Liquidity zone is where I want to pay attention, but the actual entry will depend on price
I don't need to predict the entire move in advance. I just need to identify the important areas and wait for the market to show its hand.
#BNB_Market_Update #bnb