


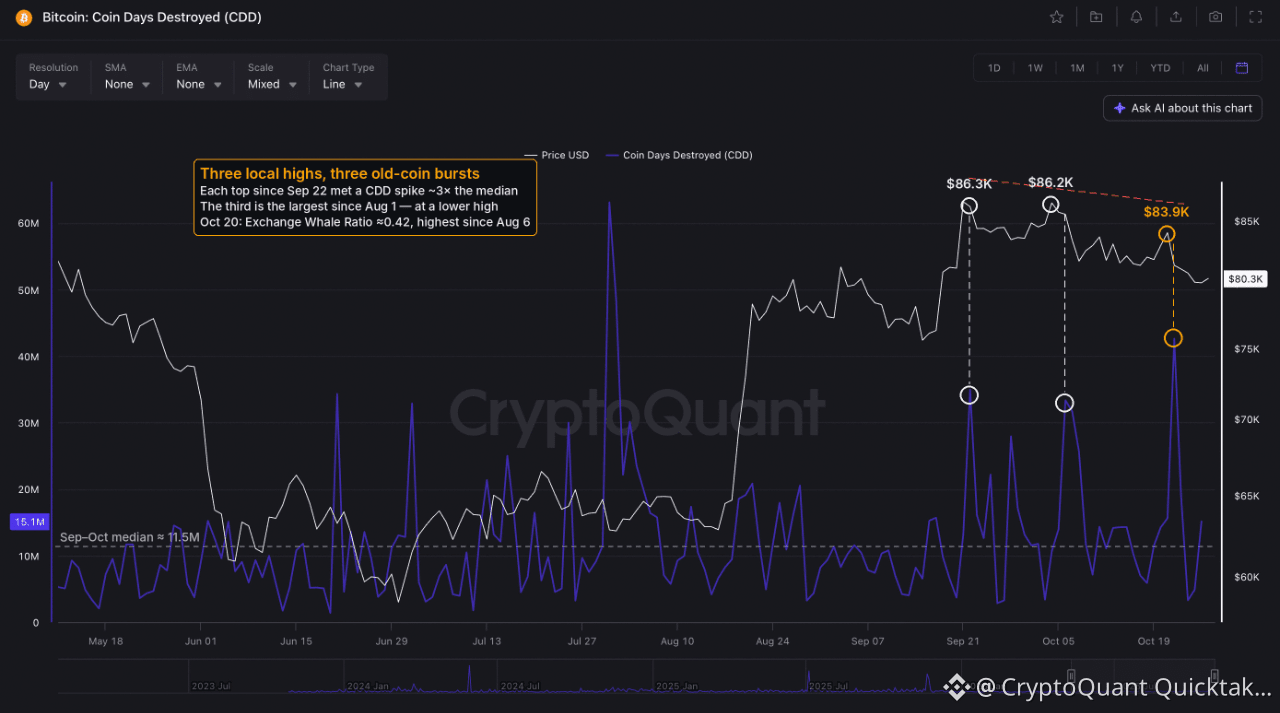
Coin Days Destroyed (CDD) has increased sharply at every local Bitcoin high since September. On September 22 it reached around 34M as Bitcoin peaked near $86.3K. A similar pattern appeared on October 6-8. The latest spike happened on October 22, one day after Bitcoin's rebound peaked near $83.9K. This was also around 3.7 times higher than the September-October median of 11.5M. Interestingly, Bitcoin has been making lower highs while CDD spikes have remained relatively strong or even increased.
But first two spikes don’t necessarily indicate selling pressure. Both happened during periods of large net exchange outflows. On September 22, around 19.1K BTC left exchanges, followed by another 14.2K BTC on October 6. At the same time, the Exchange Whale Ratio remained close to its median of 0.23. This situation makes me think that these movements most probably related to transfers between wallets rather than actual selling.
Third spike shows a different thing. On October 20 the Exchange Whale Ratio increased to around 0.42 which was its highest level since August 6. This means that large deposits from whales made up a much bigger share of total exchange inflows. Two days later, CDD reached 43M while the taker buy/sell ratio dropped to approximately 0.92. This shows stronger selling activity in the market. Spent Output Age Bands also show that most of the coins moved on October 22 belonged to the 1M–3M group. These investors were holding around 12% unrealized profit at that time.
Of course, a rise in CDD doesn’t always mean that investors are selling, as it can also reflect transfers between wallets. But the combination of increased old-coin activity, higher whale deposits and Bitcoin forming another lower high suggests that distribution may be taking place. So far, this is one of the strongest on-chain signals of selling pressure within the current price range.
Written by YavuzAkbay