


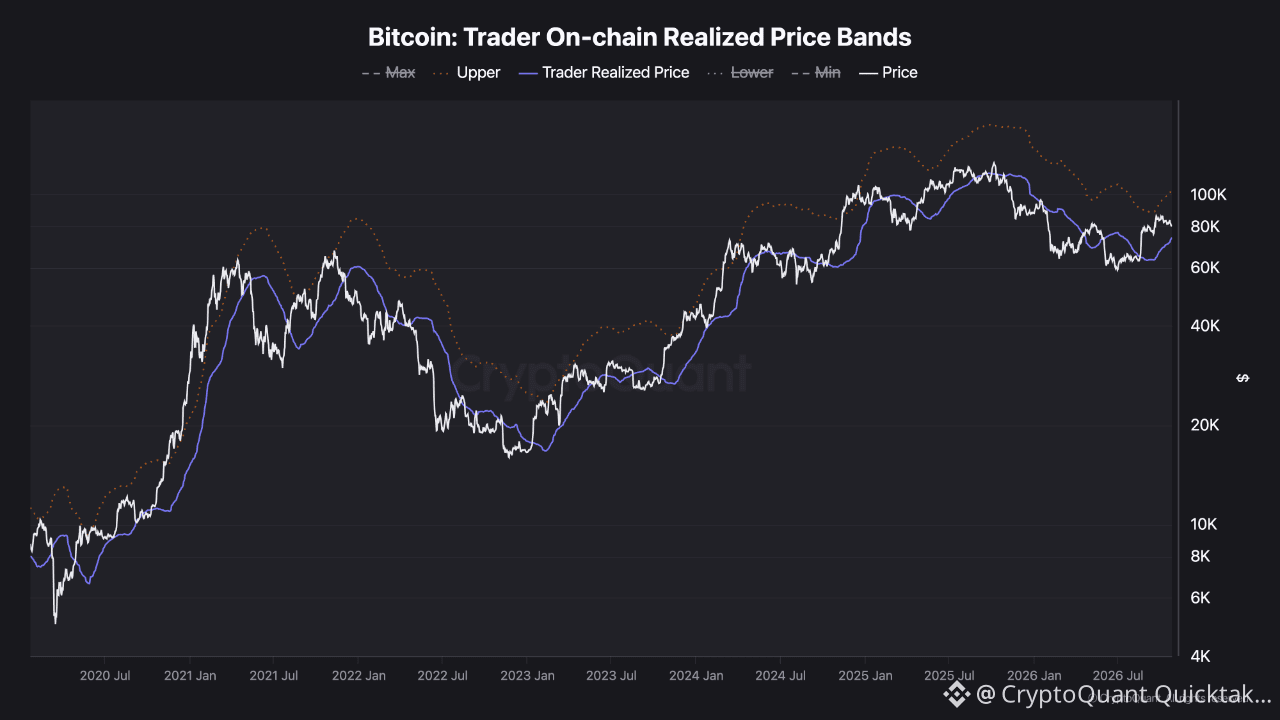
The Trader On-chain Realized Price reflects the average acquisition price of BTC that last moved between 1 and 3 months ago — effectively the cost basis of relatively recent market participants.
The current structure is interesting.
BTC is trading around the low-$80K area, while the Trader Realized Price has risen into the mid-$70K region.
This means price is still trading above the average cost basis of recent traders.
Historically, during bullish phases, this realized price has often acted as support when BTC corrected toward it. When price stayed below it, however, the same level could turn into resistance as underwater traders sold near breakeven.
The Upper Band is also worth monitoring.
In previous periods, price approaching the Upper Band often coincided with increased profit-taking pressure and short-term corrections.
So I currently read the structure in two steps:
• If BTC continues higher: watch the Upper Band for signs of increasing profit-taking risk.
• If BTC corrects: the Trader Realized Price becomes an important support level to monitor.
The key point is that neither level should be treated as an automatic trade signal.
The Upper Band does not guarantee a top, and the Realized Price does not guarantee a bounce.
But they provide useful reference points for where recent market participants may begin changing behavior.
For now, BTC remains above the Trader Realized Price, so the short-to-medium-term cost-basis structure is still constructive.
If a deeper correction develops, I would pay close attention to whether this rising realized price can continue acting as support.
Written by Trdaer_Gemini