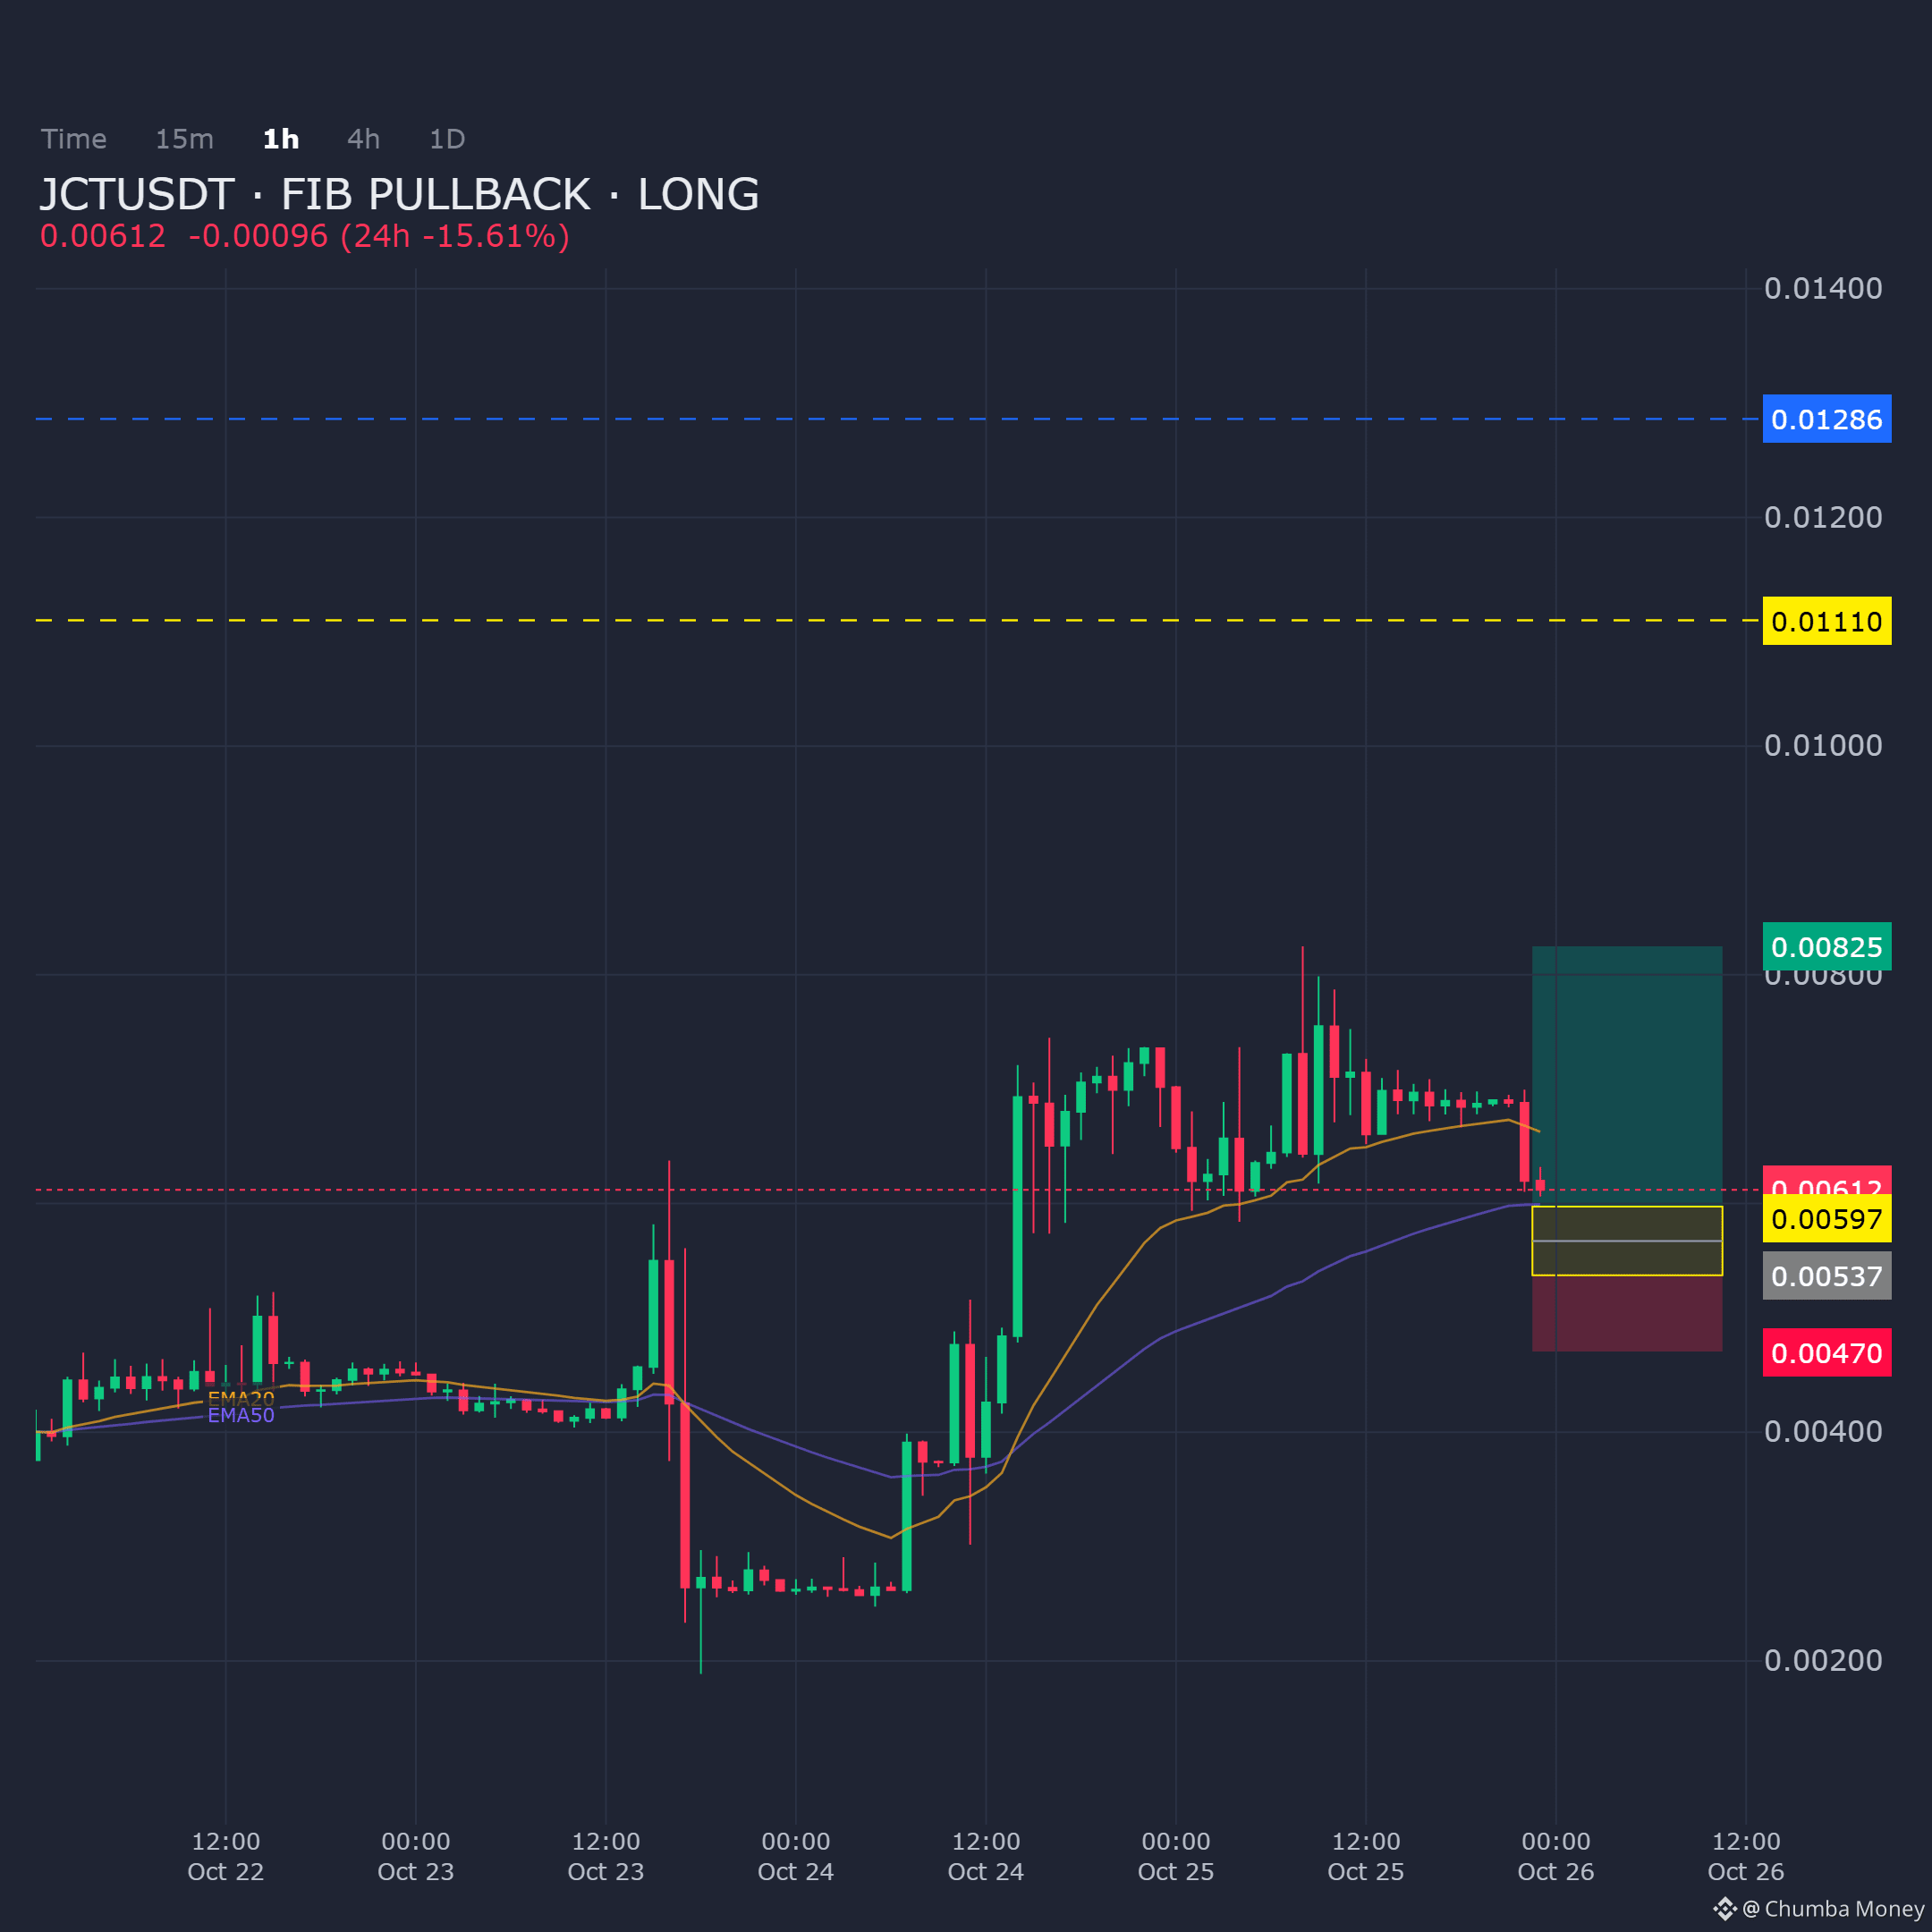

JCTUSDT is on the 1H chart, drawing back into a Fibonacci pullback zone. Demand around this region keeps the structural bias tilted toward the long side.
Entry: 0.005373 - 0.005972
Targets: TP1: 0.00825, TP2: 0.0111, TP3: 0.012861
Stop Loss: 0.004705
$JCT
Entry: 0.005373 - 0.005972
Targets: TP1: 0.00825, TP2: 0.0111, TP3: 0.012861
Stop Loss: 0.004705
$JCT