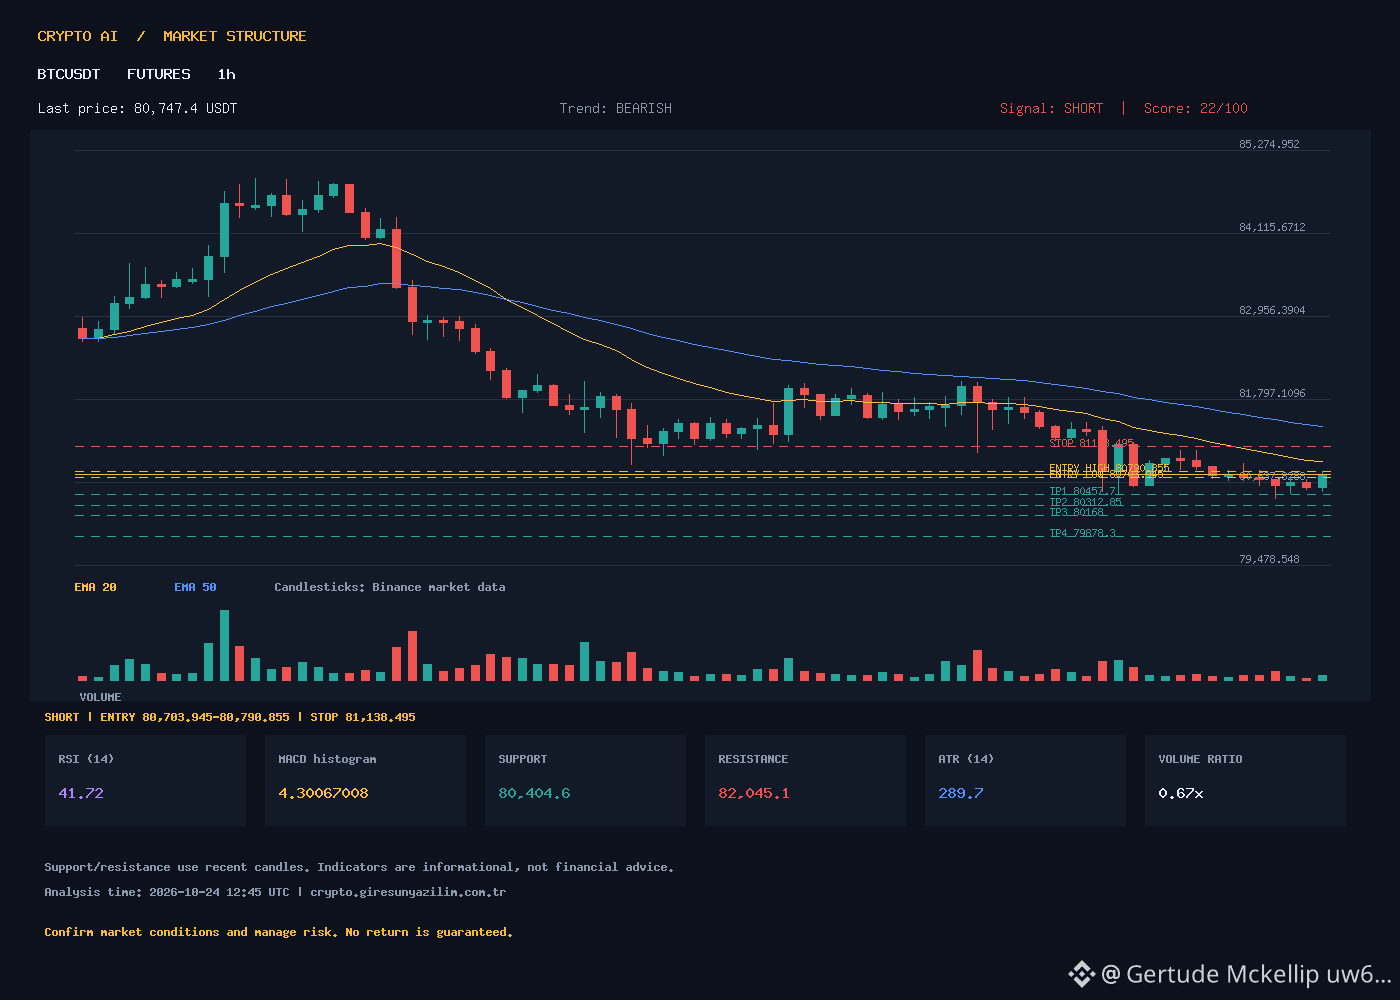
BTCUSDT Teknik Analiz: Ayı Trendi Hakim | BTCUSDT Technical Analysis: Bearish Trend Dominates
🇹🇷 TÜRKÇE
BTC 1 saatlik grafikte belirgin bir düşüş trendinde. Fiyat (80747.4), EMA20 (80923.28), EMA50 (81394.82) ve EMA200 (81824.34) seviyelerinin altında seyrederek güçlü bir satış baskısını onaylıyor. RSI 41.72 ile zayıf momentumu, MACD ise negatif bölgede seyrediyor. Hacim ortalamanın altında (%67) kalarak düşük katılımı gösteriyor. Destek 80404.6, direnç ise 82045.1 seviyesinde.
Sinyal: SHORT (Süre: 1S)
Giriş Aralığı: 80703.945 - 80790.855
Stop-Loss: 81138.495
TP1: 80457.7
TP2: 80312.85
TP3: 80168
TP4: 79878.3
Bu seviyeler ATR tabanlı senaryolardır, garanti sonuçlar veya kişisel yatırım tavsiyesi değildir.
Sizce BTC 80.000 psikolojik sınırının altında kalıcılık sağlayabilir mi?
🇬🇧 ENGLISH
BTC is in a distinct downtrend on the 1h timeframe. The price (80747.4) is trading below EMA20 (80923.28), EMA50 (81394.82), and EMA200 (81824.34), confirming strong selling pressure. RSI at 41.72 indicates weak momentum, while MACD remains in negative territory. Volume is below average (67% ratio), suggesting low participation. Support is at 80404.6 and resistance at 82045.1.
Signal: SHORT (Timeframe: 1H)
Entry Range: 80703.945 - 80790.855
Stop-Loss: 81138.495
TP1: 80457.7
TP2: 80312.85
TP3: 80168
TP4: 79878.3
These levels are ATR-based scenarios, not guaranteed outcomes or personalized financial advice.
Do you think BTC will maintain its position below the 80,000 psychological threshold?
#BTC #Bitcoin #KriptoAnaliz #Trading #TechnicalAnalysis