

#MarketSentimentToday #BTC 🌍 #PositiveMindsGlobalResults Binance Square | October 24, 2026
Forecast window: approximately 02:35 MYT, 24 October, to 02:35 MYT, 25 October · Prices in USD
My approach is to combine recent price action, support and resistance, institutional fund flows, macroeconomic risks, and conditional bullish and bearish scenarios. The objective is to produce a realistic forecast range—not promise a price target that the market may never reach.
The most important finding so far: the crypto market is facing conflicting signals. Bitcoin recently attracted substantial institutional ETF inflows, but a subsequent sharp outflow and elevated oil prices have increased the risk of another sell-off. Ethereum faces additional pressure from weaker ETF flows and uncertainty around a planned network upgrade.
1. Forecast summary

These are my own scenario-based estimates, not prices guaranteed by an exchange or a live market feed. The BTC reference is supported by October 23 market data around $81,400–$81,600; the ETH reference is based on recent reporting around $2,385; and CoinGecko's retrieved BNB snapshot showed $733.16. Prices may have changed since those observations.
Asset Bullish extension Base case Bearish extension
BTC $83,000–$84,200 $80,000–$83,000 $78,500–$80,000
ETH $2,480–$2,540 $2,320–$2,480 $2,250–$2,320
BNB $755–$770 $715–$755 $695–$715
The extension ranges describe what could happen if key levels break; they are not equally likely outcomes. The base case assumes no major unexpected geopolitical or macroeconomic shock.
2. Bitcoin (BTC/USD): detailed analysis

Reference price First support First resistance
$81,500 $80,700 $82,300
What the evidence says
Recent technical analysis places Bitcoin around $81,400–$81,600, with RSI near 47, indicating neither an oversold nor an overbought market. Important nearby levels identified by market analysts include support around $80,055–$80,730 and resistance around $82,243–$82,342. A higher resistance zone lies around $84,000–$84,200
That creates a market in which a recovery is possible, but buyers still need to reclaim overhead resistance to establish stronger short-term momentum.
Level Interpretation
$83,000–$84,200 Bullish breakout zone
$82,200–$82,600 Immediate resistance
$81,000–$81,500 Near-term decision area
$80,000–$80,700 Major nearby support
$79,000–$79,700 Lower support if selling accelerates
$78,500 Bearish extension level
Three possible outcomes
Bullish: BTC holds above $81,000 and breaks through $82,300 with strong spot buying. The next test is $83,000, followed by $84,000–$84,200.
Neutral: BTC repeatedly fails to break $82,300 but buyers defend $80,000–$80,700. Price remains range-bound.
Bearish: BTC loses $80,000 on sustained selling. A move toward $79,000–$79,700 becomes plausible, with $78,500 as a further downside scenario.
My assessment: Bitcoin has the clearest nearby technical reference levels of the three assets. However, I would not label the next 24 hours strongly bullish unless BTC reclaims resistance and holds it on a meaningful hourly close.
3. Ethereum (ETH/USD): detailed analysis
Ethereum has a more fragile short-term setup than Bitcoin. Recent technical data placed ETH near $2,396 on 23 October, with RSI around 40, immediate support near $2,349, and resistance near $2,436.
ETH levels to watch
Level Interpretation
$2,500–$2,540 Stronger recovery zone
$2,460–$2,480 Near-term bullish target
$2,430–$2,440 First important resistance
$2,380–$2,400 Immediate decision area
$2,340–$2,360 Key support zone
$2,300–$2,320 Major downside test
$2,250–$2,285 Bearish extension
These zones combine reported technical levels with rounded scenario boundaries. They are not guarantees that price will touch each level.
Why ETH may underperform BTC
1. Institutional flows: Recent reporting showed roughly $1.08 billion in net outflows from U.S. spot Ether ETFs through 20 October. There was a modest $14.9 million inflow on 21 October, but one positive session does not establish a sustained reversal.
2. Network upgrade uncertainty: Ethereum developers postponed the planned 26 October activation on the Hoodi testnet for the Glamsterdam upgrade. This is a development-timeline issue, not evidence that Ethereum itself has failed.
3. Technical momentum: ETH's reported short-term trend was bearish even though some daily indicators remained constructive. This disagreement raises the possibility of sharp reversals in either direction.
Three possible outcomes
Bullish: ETH holds $2,350 and recovers $2,440. A move toward $2,480–$2,500 becomes possible.
Neutral: ETH fluctuates around $2,350–$2,440 as buyers and sellers remain balanced.
Bearish: ETH breaks below $2,340–$2,350 and cannot recover the level. Price could test $2,300–$2,320, with $2,250–$2,285 as a lower scenario.
My assessment: ETH needs to reclaim $2,440 before I would become more confident in a recovery. Sustained trading below $2,350 would weaken the near-term outlook. Among these three assets, ETH has a particularly important combination of ETF-flow and technical risks.
4. BNB/USD: detailed analysis

BNB's recent retrieved price was $733.16, with a reported 24-hour range of $726.86–$744.42. Technical pivot calculations published on 23 October identified resistance around $745–$746, with further resistance near $760 and $770. Support levels were approximately $721, $711 and $697.
Level Interpretation
$760–$770 Bullish extension
$750–$755 Recovery and breakout test
$745–$746 Immediate resistance
$730–$735 Near-term decision zone
$720–$722 First important support
$710–$712 Secondary support
$695–$700 Deeper downside support
What could move BNB over the next 24 hours?
Bitcoin direction: A BTC rebound could support BNB, while a sharp BTC decline could pull BNB below its local support levels.
Binance ecosystem demand: Actual activity and demand for BNB utility may support its relative performance, but ecosystem strength does not prevent short-term selling.
Market liquidity: Weekend conditions can produce sharp price moves when order-book liquidity is thin. A breakout without strong volume may fail.
Token supply: BNB's quarterly burn reduces token supply, but its short-term price impact depends on demand and market positioning. A burn announcement alone is not a reliable buy signal.
Three possible outcomes
Bullish: BNB holds $730, reclaims $745–$746 and breaks $755. The next possible target is $760–$770.
Neutral: BNB trades between $720 and $745 as the market consolidates.
Bearish: BNB breaks below $720. A retest of $710–$712 becomes plausible, with $695–$700 as a lower scenario.
My assessment: BNB has a reasonably well-defined short-term range. I would want to see a sustained move above $745–$755 before treating the market as convincingly bullish.
5. The biggest market-wide risk: oil, inflation and institutional flows
Oil prices are a major concern
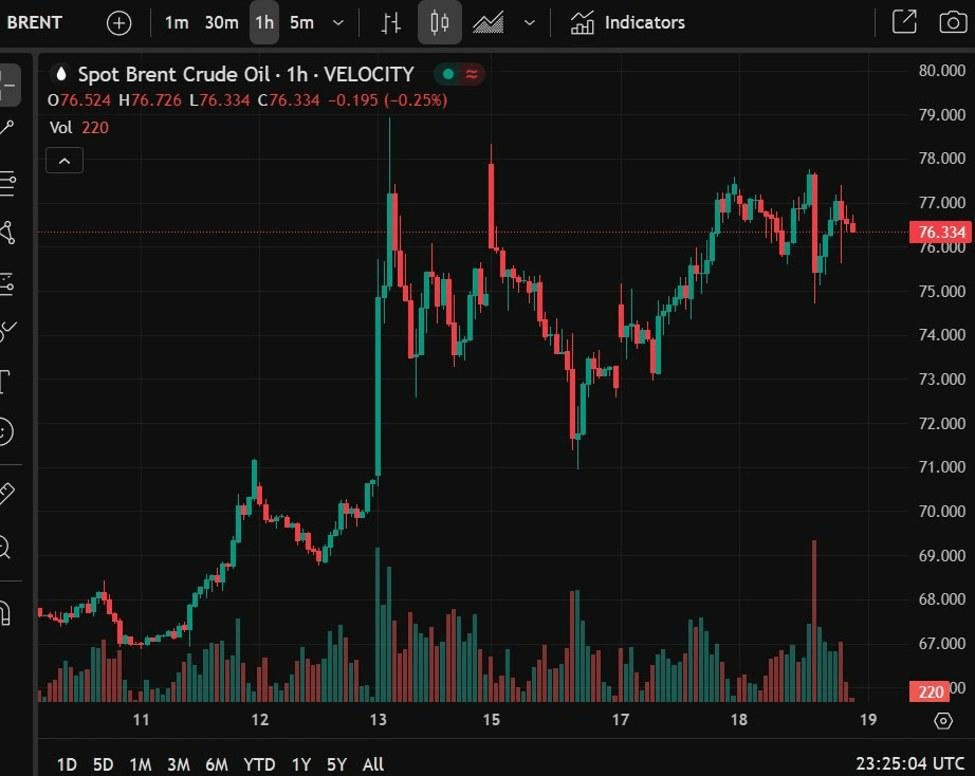
Reuters reported on 23 October that Brent crude surged to $117.18 per barrel amid escalating Houthi-Saudi fighting and concerns about Middle East supply disruptions. WTI reached $103.22.
Why does this matter for crypto?
Higher oil prices can increase inflation concerns.
Persistent inflation can limit expectations for interest-rate cuts or increase concerns about tighter monetary policy.
Higher yields and reduced appetite for risk can pressure speculative assets, including BTC, ETH and BNB.
If geopolitical tensions ease and oil falls, crypto could receive relief from improving risk sentiment.
This is a potential transmission mechanism, not a certainty. Crypto can rise even during an oil rally if other forces—such as institutional buying—are strong enough.

Bitcoin ETF flows: a warning about volatility
U.S. spot Bitcoin ETFs reportedly experienced approximately $526.7 million in inflows on 19 October and $524.8 million on 21 October, followed by about $635.6 million in outflows on 22 October. That reversal demonstrates how quickly institutional flows can change
For the next 24 hours, the key question is not simply whether ETFs previously attracted money. It is whether demand resumes and remains strong enough to absorb selling.
Upcoming Federal Reserve decision
Reuters reported that the Federal Reserve's next meeting is scheduled for 27–28 October. Markets are also watching high oil prices, corporate earnings and central-bank decisions elsewhere.
Because your forecast window ends before the Fed decision, the market may trade on expectations and positioning rather than the decision itself. Unexpected headlines could still override technical levels.
6. Probability-weighted outlook
The following probabilities are my subjective scenario estimates, not probabilities published by an exchange or derived from a calibrated forecasting model.
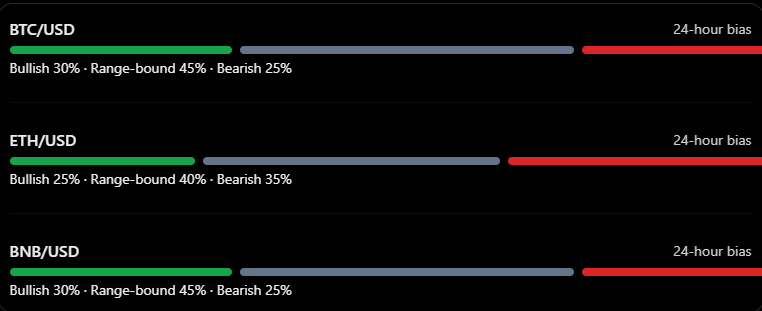
These estimates express my current view of the competing scenarios. They should not be interpreted as statistically verified odds or precise probabilities of closing at a particular price.
7. What would change my forecast?
Bullish confirmation Above $82,300–$82,600 Above $2,440 Above $745–$755
Warning level Below $80,700 Below $2,350 Below $720
Deeper downside trigger Below $80,000 Below $2,320 Below $710
Higher upside test $84,000–$84,200 $2,480–$2,540 $760–$770
These are monitoring thresholds, not automatic buy or sell instructions. Give greater weight to a sustained close and volume confirmation than to a brief wick through a level.
Final conclusion
My baseline forecast for the next 24 hours is cautious consolidation with downside risk, rather than a confident broad-market rally.
BTC: $80,000–$83,000. Watch $80,000 support and $82,300–$82,600 resistance.
ETH: $2,320–$2,480. Watch whether $2,350 holds and whether buyers can reclaim $2,440.
BNB: $715–$755. Watch $720 support and the $745–$755 recovery zone.
The main risk to this forecast is a sharp change in oil prices, geopolitical headlines or institutional flows. Any of these could push prices outside the base-case ranges.
Important data limitation: I could verify recent market snapshots and technical levels, but I could not establish a single synchronized live order-book snapshot for all three assets at precisely 02:35 MYT. Treat the reference prices as approximate, and recheck live exchange prices before publishing or acting on this forecast.
For a Binance Square post, the most defensible headline would be: “BTC, ETH & BNB: Next 24 Hours — Critical Support Levels, Oil Risks and Three Market Scenarios.”
Disclaimer: This is market research and scenario analysis, not financial advice. Cryptocurrency prices are volatile, forecasts can be wrong, and no price target is guaranteed. DYOR.
#PositiveMindsGlobalResults #BinanceSquare #BTCNext24Hours #ETHNext24Hours #BNBNext24Hours #BitcoinPricePrediction #EthereumPriceForecast
#BNBPricePrediction #CryptoMarketOutlook #CryptoForecast2026
#BTCETHBNB #BitcoinSupportAndResistance #CryptoTechnicalAnalysis #CryptoMarketSentiment #OilShockAndCrypto #BitcoinETFFlows #CryptoVolatilityWatch #BullishOrBearish #CriticalPriceLevels #Next24HourCryptoForecast #EstimatesNotAdviceButHope