


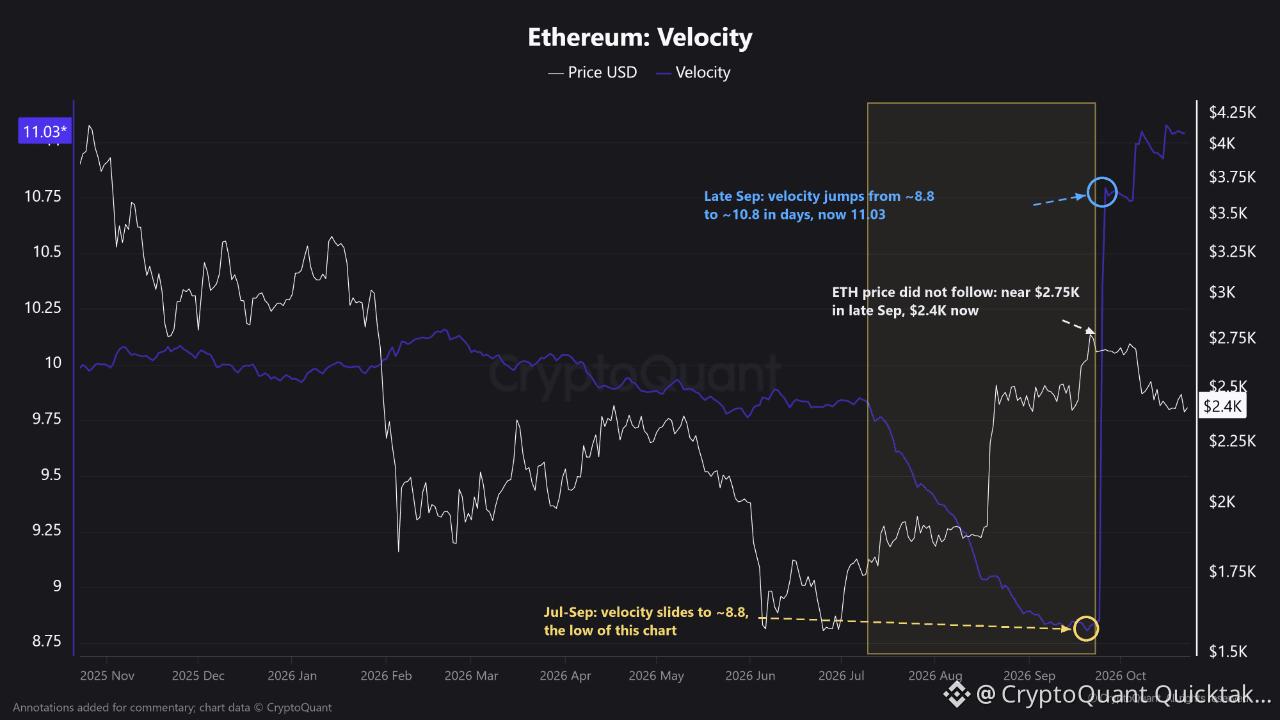
Ethereum Velocity (CryptoQuant, daily) is calculated from ETH's trailing one-year on-chain transfer volume relative to supply. Because the numerator is a rolling one-year sum, the metric normally moves slowly. Day-to-day changes are small, since each new day is added while the day from a year ago drops out.
That is what makes the recent move stand out.
- Nov 2025 - mid-Jul 2026: velocity held between roughly 9.8 and 10.1.
- Mid-Jul - late Sep: a steady decline to around 8.8, the low of the period. The newer days recorded far less transfer volume than the days rolling out of the window.
- Late Sep: a near-vertical step from around 8.8 to around 10.8, followed by smaller steps to the latest reading of 11.03.
A rise of about 2 points in a few days means the window absorbed transfer volume worth around 23% of its previous one-year total in a very short span. That pattern fits a handful of very large transfers better than a broad pickup in network use. Possible sources include exchange or custodian wallet reshuffles, contract migrations or large holder repositioning. Entity-level flow data is needed to confirm which.
Price context matters. ETH printed its local high near 2.75K around the step and has since slipped to about 2.4K. Elevated turnover with weakening price leans toward supply moving into the market rather than fresh demand.
Invalidation: if exchange inflows stay muted and ETH reclaims the late-September high, the spike is more likely internal movement than distribution.
Conclusion: the velocity jump is real, but its source is still unconfirmed. Until price confirms, treat it as a caution signal, not a demand signal.
Written by Rei Researcher