

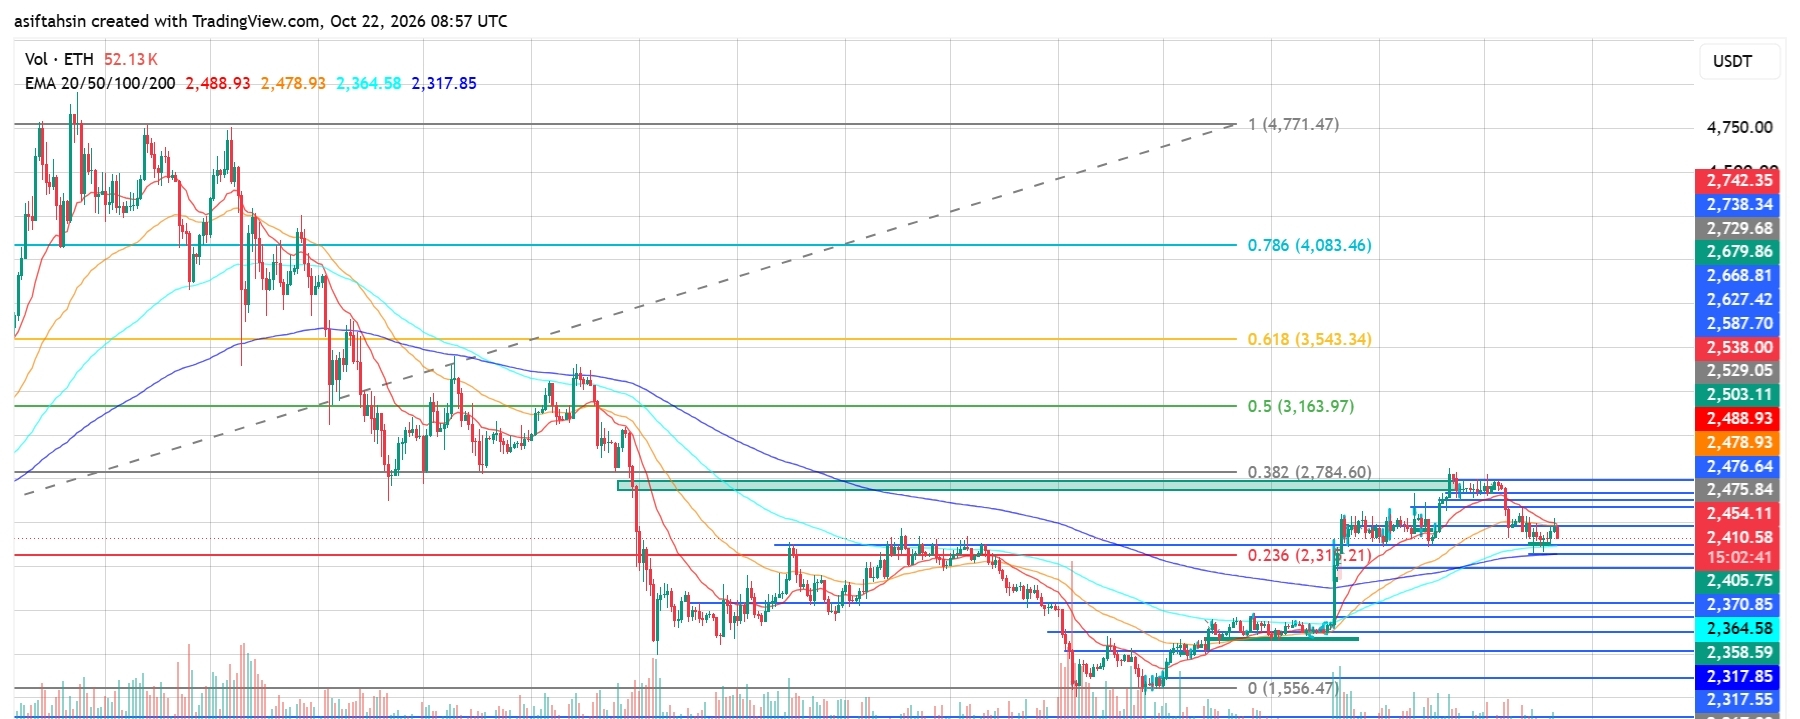

Ethereum is currently trading around $2,410–$2,411, pulling back after its recovery from the June low near $1,556 and its recent rally toward the $2,475–$2,500 resistance zone. ETH has lost short-term momentum and is now testing an important support area around $2,405–$2,370.
The broader recovery remains in progress, but short-term pressure has increased as ETH trades below its 20 and 50 EMAs. Buyers need to reclaim $2,475–$2,489 to strengthen the bullish outlook, while losing the $2,370–$2,358 support zone could trigger a deeper correction.
📊 EMA Structure
* 20 EMA: $2,488.94
* 50 EMA: $2,478.93
* 100 EMA: $2,364.58
* 200 EMA: $2,317.85
ETH is trading below the 20 and 50 EMAs but remains above the 100 and 200 EMAs. This signals short-term weakness within a broader recovery structure.
The $2,479–$2,489 EMA cluster is the immediate resistance to reclaim. On the downside, holding above the 100 EMA near $2,364.58 would help preserve the broader recovery, while the 200 EMA near $2,317.85 represents another important support.
📐 Fibonacci Levels
Based on your chart:
* 0: $1,556.47
* 0.236: $2,317.21
* 0.382: $2,784.60
* 0.5: $3,163.97
* 0.618: $3,543.34
* 0.786: $4,083.46
* 1.0: $4,771.47
ETH is trading above the 0.236 Fibonacci level near $2,317.21 but remains below the 0.382 level at $2,784.60. Reclaiming the nearby EMA cluster would improve the short-term outlook, while a sustained breakout above $2,500 could help buyers attempt a recovery toward higher resistance levels.
🚀 Bullish Scenario
If ETH holds the $2,405–$2,370 support area and buyers regain control, a recovery could develop toward:
🎯 $2,454–$2,477
🎯 $2,479–$2,489
🎯 $2,503–$2,538
🎯 $2,588–$2,627
🎯 $2,679–$2,742
🎯 $2,784 — 0.382 Fibonacci
A sustained move above $2,489 would be the first sign of improving momentum. A breakout above $2,538 would strengthen the recovery and could open the path toward $2,588–$2,627. The $2,784 Fibonacci level remains a larger upside objective if bullish momentum continues.
🔄 Pullback Scenario
If ETH fails to reclaim the $2,479–$2,489 resistance zone and selling pressure increases, watch these support areas:
* $2,405–$2,400
* $2,370–$2,358
* $2,317–$2,318 — 0.236 Fibonacci and 200 EMA area
* $2,267
* $2,241
A pullback toward $2,370–$2,358 could be a normal retest within the broader recovery. However, losing this zone would weaken the structure and increase the risk of a move toward $2,317.
If $2,317 fails to hold, further downside toward $2,267–$2,241 could come into focus.
📊 RSI Momentum
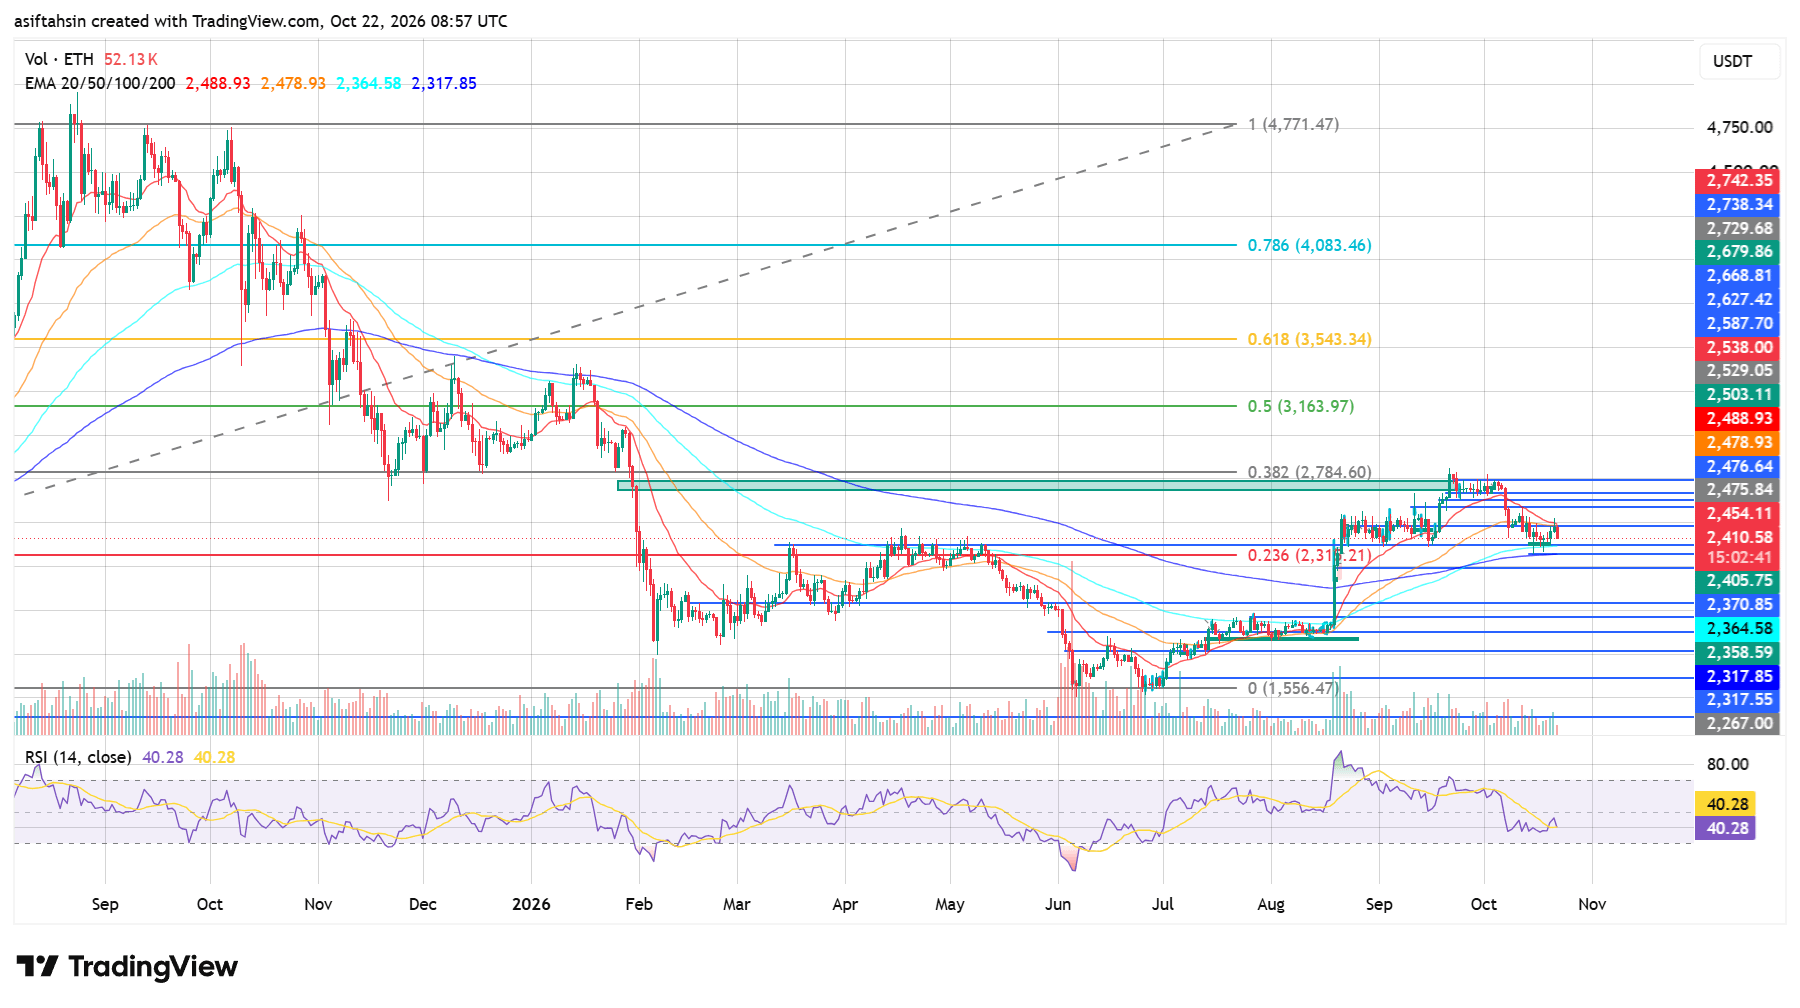
* RSI: 40.28
* RSI Signal Average: 40.28
RSI is below the neutral 50 level, indicating that bullish momentum has cooled. The indicator is approaching oversold territory, but that alone does not confirm a reversal.
A move back above 45–50 would support a recovery attempt, while a sustained drop below 40 could indicate increasing downside pressure.
📈 Market Structure & Liquidity
ETH has recovered strongly from the June low near $1,556, building a broader upward recovery toward the $2,475–$2,500 region. However, the latest rejection has pushed price back toward the $2,400 area.
The market is now testing whether the $2,405–$2,370 zone can act as support. The 100 EMA near $2,364.58 is particularly important because it sits close to this support region.
The broader recovery remains more constructive while ETH holds above $2,317, but buyers need to reclaim the $2,479–$2,489 EMA cluster to regain short-term control. A confirmed breakout above $2,538 would provide stronger evidence of bullish continuation.
🔑 Key Levels
Resistance
* 🔴 $2,454–$2,477
* 🔴 $2,479–$2,489
* 🔴 $2,503–$2,538
* 🔴 $2,588–$2,627
* 🔴 $2,679–$2,742
* 🔴 $2,784
Support
* 🟢 $2,405–$2,400
* 🟢 $2,370–$2,358
* 🟢 $2,317
* 🟢 $2,267
* 🟢 $2,241
🎯 Final Outlook
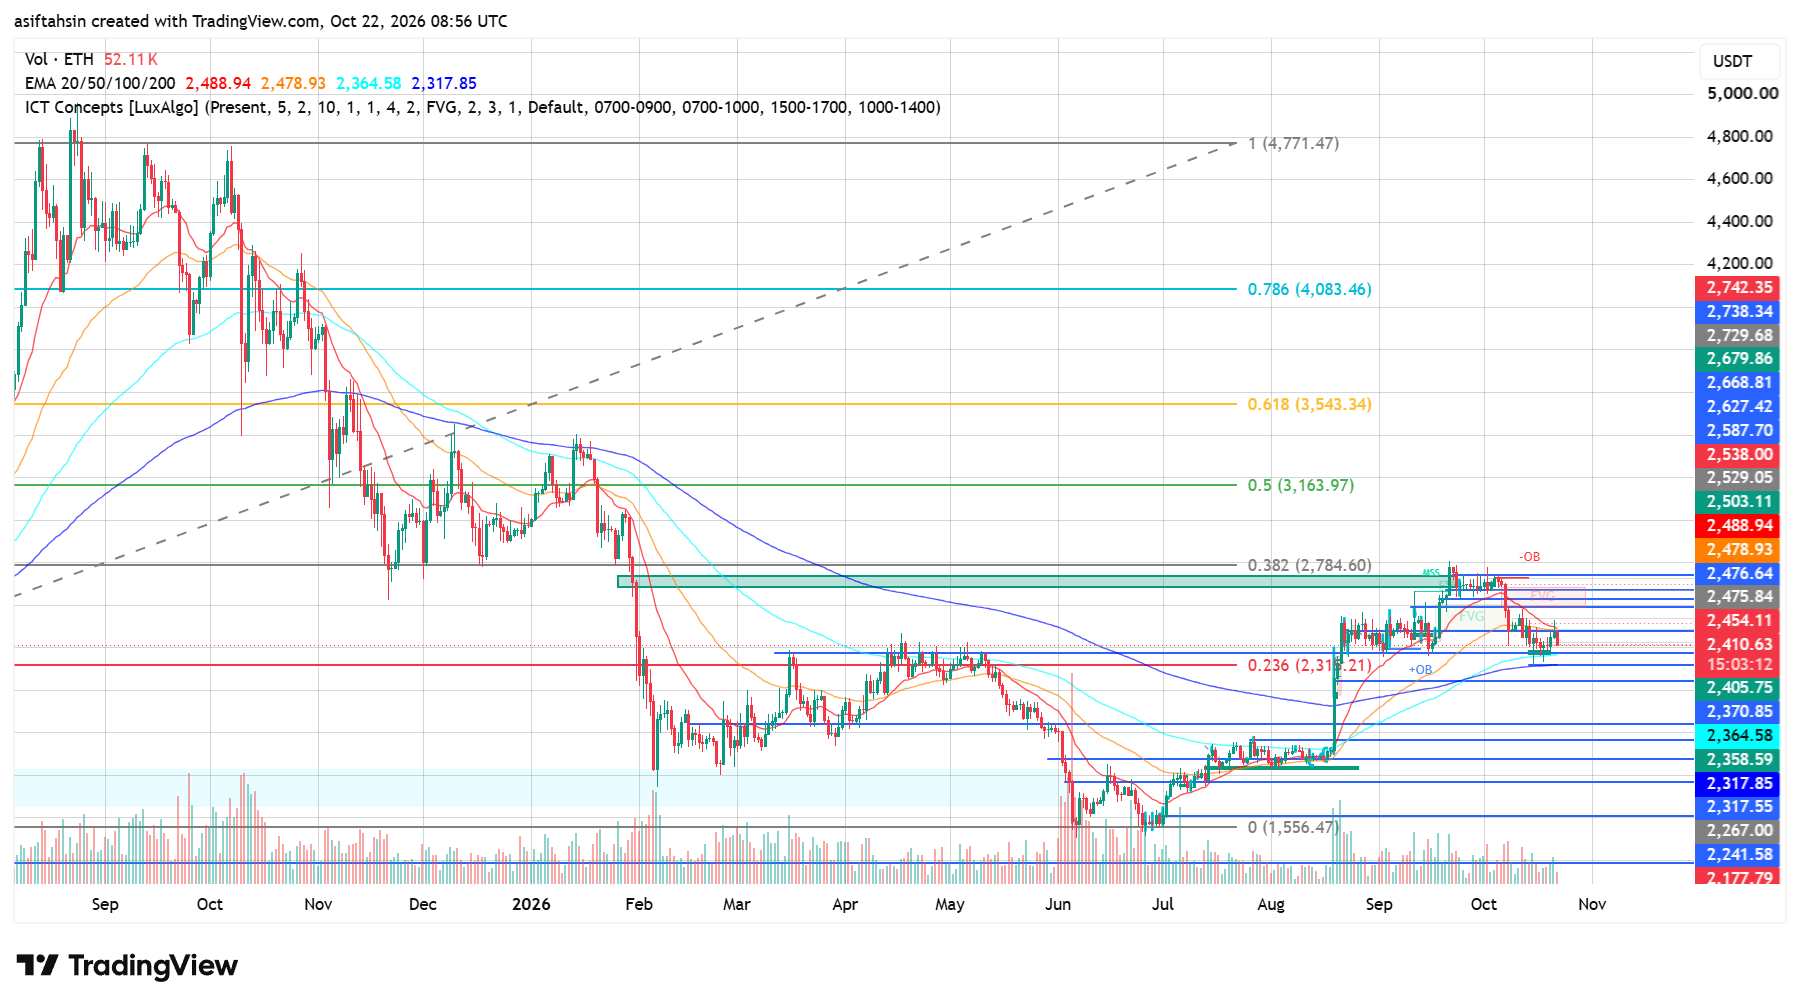
ETH remains neutral-to-bearish in the short term while trading below $2,479–$2,489, but the broader recovery structure remains intact above the $2,317 support area.
A sustained breakout above $2,489 could open the path toward $2,503–$2,538, followed by $2,588–$2,627. On the downside, losing $2,358 would increase the risk of a deeper correction toward $2,317 and potentially $2,267–$2,241.
Bias: 🟡 Neutral-to-bearish below $2,489 | Breakout above $2,538 → $2,627 → $2,784
