


Bitcoin traded at $83,411 on Wednesday, October 21, up 2.51% in 24 hours, but still 23% below where it stood a year ago. Oil prices near $110 a barrel and a Federal Reserve back in hiking mode kept pressure on risk assets. Over the same 12 months, Brent crude has climbed 79%, the S&P 500 has gained 15% and gold is roughly flat.
BTC is the only one of the four in the red. And yet J.P. Morgan Asset Management just ranked it first for returns over the next decade.
So what has been holding the Bitcoin price back, and what would have to change?
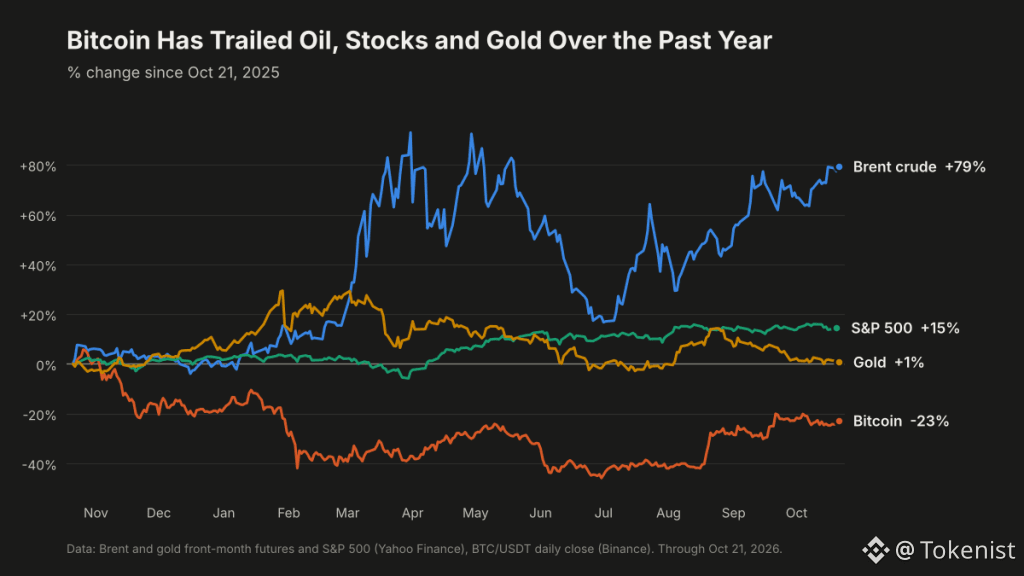 Bitcoin vs Oil, Stocks and Gold: What Changed in a Year?
Oil changed. Brent closed at $61.32 a barrel on October 21, 2025, and trades at about $110 today, after a war with Iran disrupted shipping through the Strait of Hormuz for much of 2026. BTC went the other way. It hit its record of $126,080 on October 6, 2025, and sits 34% below it now.
The link is inflation. September’s consumer prices rose 3.7% from a year earlier, with gasoline up 9.1% in the month alone, the Bureau of Labor Statistics reported on October 14. The Fed had already delivered a quarter-point rate hike, taking its target to 3.75%–4% on September 16, and the 10-year Treasury yield has risen from 3.96% to 5.12% over the year.
When cash and bonds pay 5%, a coin that pays nothing has to work harder for buyers. Stocks had earnings to lean on. BTC didn’t.
Discover: Oil, Yields and Liquidations Stack Pressure on Bitcoin
What Is J.P. Morgan’s BTC Forecast Based On?
A 10% return a year for the next decade, the highest number in the bank’s 2027 Long-Term Capital Market Assumptions, ahead of U.S. real estate trusts at 8.2%, U.S. large caps at 7.5% and gold at 5.5%. It is the first J.P. Morgan Bitcoin forecast in the report’s 31 years. Strategy’s Michael Saylor shared the table on X within hours.
The fine print is less cheerful. The report also lays out a bull case of 16.6% a year and a bear case of minus 11.2%, starting from $83,000 at the end of September. Compounded to 2036, that is roughly:
Base case: $215,000 per BTC.
Bull case: $386,000.
Bear case: $25,000.
That range comes from 55% expected yearly volatility, more than three times gold’s 17.2%. The authors call it “a speculative asset and a hedge against monetary easing” and keep it out of their main portfolio models for now.
That “hedge against monetary easing” line is the key one. J.P. Morgan’s case needs the Fed to stop raising rates at some point, which brings the story back to oil.
Bitcoin Price: Which Levels Matter Before the Fed?
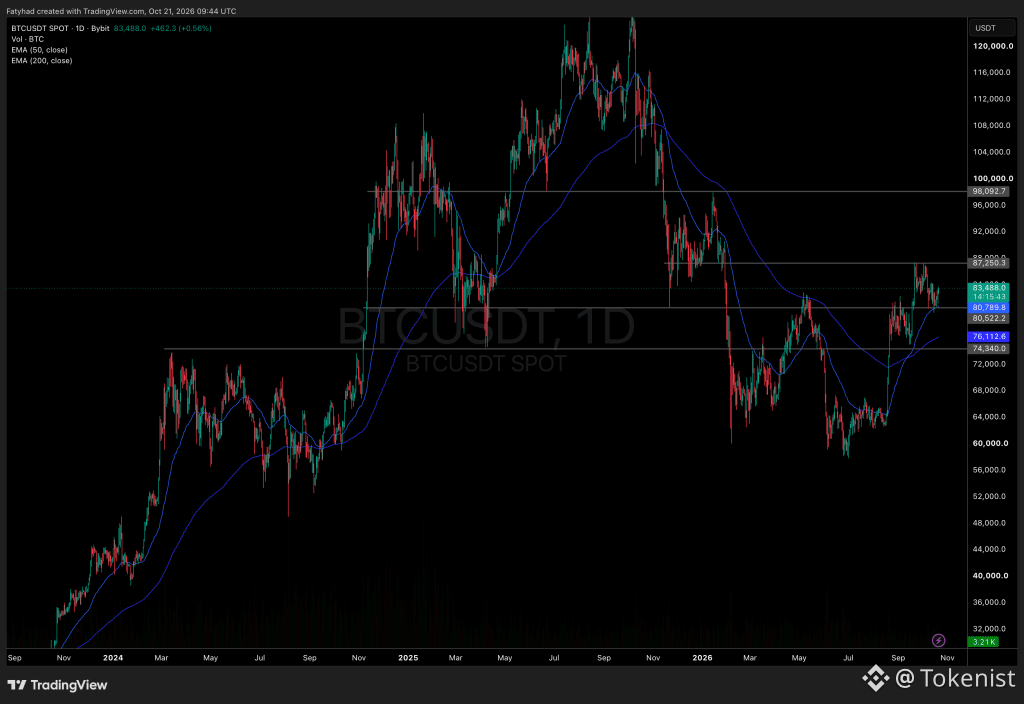 BTCUSDT Chart 1D https://www.tradingview.com/x/pvrXTCff
The ceiling: $84,146 to $84,352, the October 12–14 highs.
The next target: $87,220, the last major swing high.
The first floor: $82,563 to $82,850, a swing low and the old ceiling Bitcoin just closed above.
The real floor: $80,394 to $80,796, where a swing low meets the 50-day exponential moving average (EMA).
In the bull case, a confirmed U.S.–Iran deal sends oil lower and BTC through $87,220 before the Fed’s October 27–28 meeting. In the base case, it chops between $80,394 and $84,352 as headlines come and go. In the bear case, another denial pushes Brent above $111 and BTC below $80,394, with the 200-day EMA at $76,116 the next stop.
A year ago, BTC had just set a record and oil was at $61. Both have flipped since, and J.P. Morgan’s 10% only starts to look reachable once oil flips back.
The post Bitcoin Is Down 23% in a Year While Oil Rose 79%. J.P. Morgan Still Ranks It First for the Next Decade appeared first on Tokenist.