

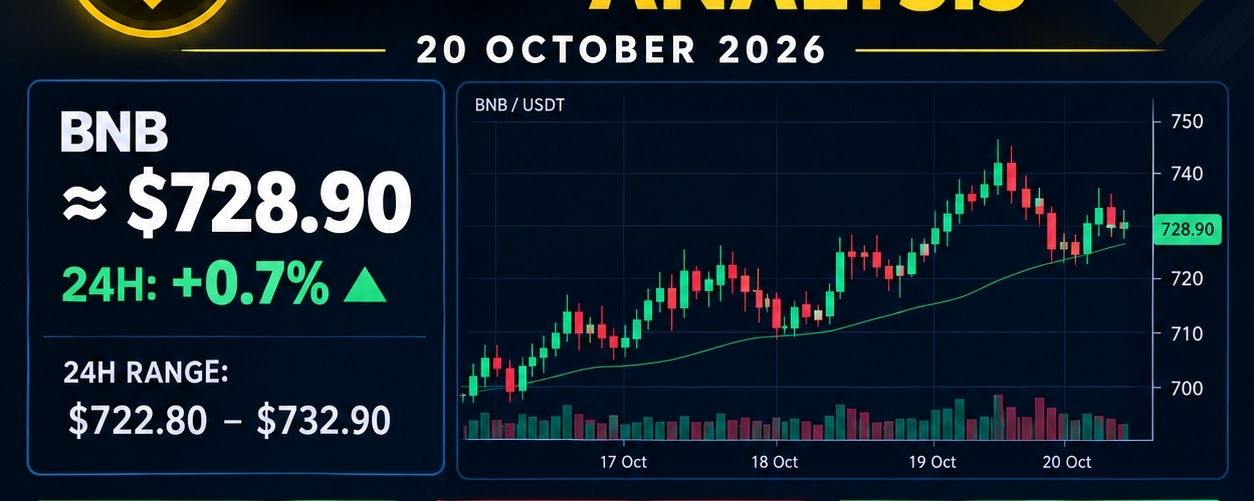

📊 BNB Latest Market Analysis — 20 October 2026
Current outlook: Cautiously Bullish | Short-Term Trading Analysis
BNB is trading around $727–$728 in the latest available market data. The price is attempting to maintain its recovery, but resistance above the current level could limit further gains. �
CoinMarketCap +1
1. 💰 Current Market Data
Current price: Approximately $727.72
24-hour change: +0.54%
24-hour low: $722.86
24-hour high: $732.59
Market capitalization: Approximately $95.7 billion
24-hour trading volume: Approximately $1.3 billion �
CoinMarketCap
These figures are the latest retrieved market snapshot, not a guaranteed live tick.
2. 📈 Technical Analysis
Support levels
$723–$720: Immediate support zone.
$719: Important short-term support.
$710–$705: Potential downside targets if selling pressure increases.
Resistance levels
$730–$733: Immediate resistance.
$740–$742: Next potential upside target.
$750: Additional resistance to watch if bullish momentum strengthens.
The $719–$728 region is particularly important. Holding above support while breaking resistance could help BNB continue its recovery. �
CoinMarketCap +1
3. 🐂 Bullish vs. Bearish Scenarios
Bullish scenario: If BNB breaks above $733 and sustains the move, the next potential target is $742. A strong breakout with increased volume would strengthen the bullish case.
Bearish scenario: If BNB loses $719, selling pressure could push the price toward $710 or $705.
Sideways scenario: If neither support nor resistance breaks, BNB could consolidate between approximately $719 and $733.
These are conditional scenarios, not guaranteed price predictions.
4. 🔥 What Is Driving BNB?
A major recent catalyst was BNB Chain's 37th quarterly token burn on October 19, which removed approximately 1.646 million BNB from the supply. BNB also benefited from a broader cryptocurrency market recovery. However, the burn alone does not guarantee further price increases. �
CoinMarketCap
5. 🎯 My Trading View
Factor
Assessment
Short-term trend
Recovering
Momentum
Mixed to positive
Immediate resistance
$730–$733
Important support
$719–$723
Overall bias
Cautiously bullish
Main risk
Breakdown below $719
My conclusion: BNB has a chance to move toward $740–$742 if buyers break through resistance. However, I would watch for a confirmed breakout rather than buying simply because the price is rising.
For the latest chart and technical indicators, check CoinMarketCap BNB� and Investing.com BNB Technical Analysis�.
Disclaimer: This analysis is for educational purposes only, not financial advice. Cryptocurrency prices can change rapidly.