



Six prompts, one thesis written before I started, and a verification table. Tested in the Binance app on October 16, 2026.
I did not ask Binance AI for a price prediction.
I asked it to audit mine.
My BTC read was already public on Binance Square before I opened the assistant. Then I asked Binance AI to read BTC independently, challenge my thesis, check derivatives, rank the macro drivers and show its sources.
Three findings:
What held up. Its levels matched my map. Its 30 day range of $75.1K to $87.4K sits on my swing low and swing high. Its description of a two sided deleveraging is consistent with the Coinglass liquidation data.
What it challenged. It pushed back on my wording that liquidity pools act as support and resistance. Fair point.
What it could not do. No live order book depth, no 24 hour open interest change, no dated macro quotes, and no chart upload at the time I tested.
Verdict: a fast and transparent second opinion. Not a data terminal.
The Premise
Most AI content in crypto is a feature tour. It teaches you nothing.
I wanted a harder question. Can Binance AI see something that a trader with a fully formed view might have missed?
So I used a rule I apply to analysts. Write the view first. Then test it. If you open the tool first, it anchors you.
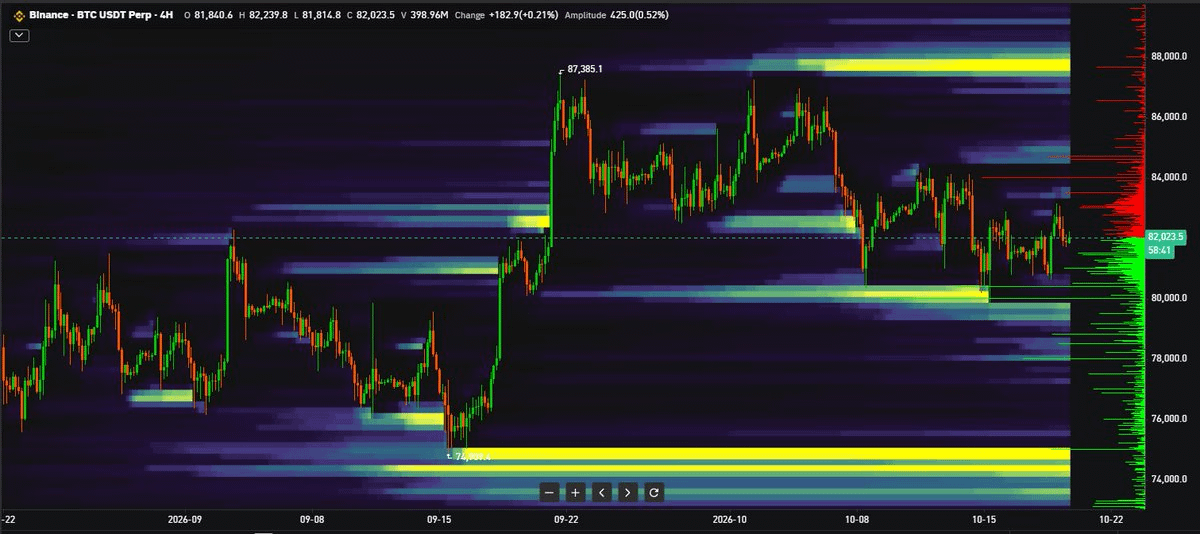
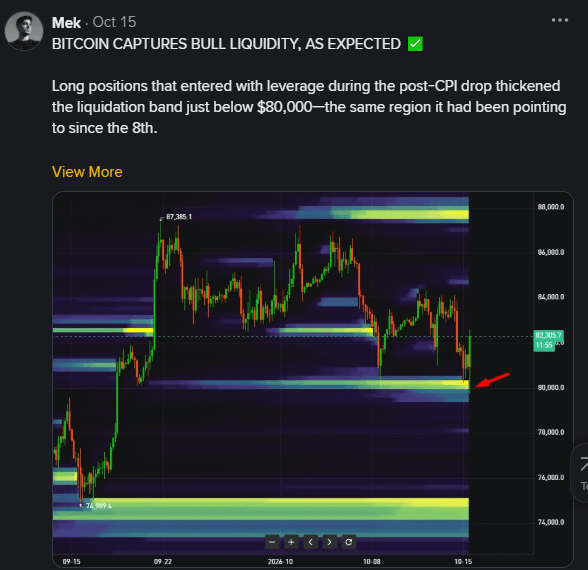
On October 15, a day before this test, I published my liquidity map on Binance Square. Dense liquidation bands near $87K to $88K above price, and near $74K to $75K below.
Methodology
Feature tested. The Binance AI assistant, which answers open questions with AI generated analysis inside the app.
Platform. Binance mobile app. At the time of testing, Binance AI was not available on web or desktop.
Input. I tried to upload my TradingView and Coinglass screenshots. There was no image upload option, so I typed my thesis instead.
Baseline tools. TradingView for structure. Coinglass for liquidations and the heatmap.
Six prompts, in this order:
A. Give me your read on BTC right now: trend, key levels, and what is driving price today.
B. Here is my read: [my thesis]. Where do you agree, where do you disagree, and what am I missing?
C. What do Open Interest, funding, and the order book say about positioning and nearby liquidity?
D. Which macro events and institutional flows matter most for BTC this week, and why?
E. Which data sources and timestamps did you use for that answer?
F. What was the 24h change in open interest and funding, and does it fit a short squeeze?
Verification. I checked what I could against my own screenshots. What I could not check, I say so.

My Pre-Registered Read
This is the thesis exactly as I typed it into the assistant:
BTC is at $82,000 after capturing liquidity yesterday below $80,000, following a period of nearly a month without dipping below that level.
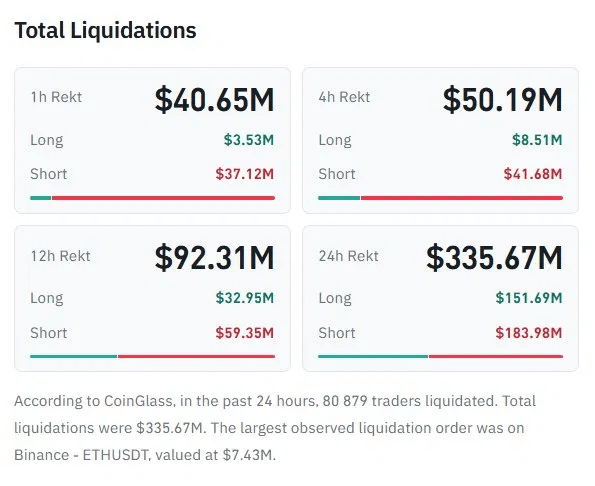
Today, a more pronounced liquidity capture occurred above. In the last 24h, a bit more than $180M was liquidated in short positions, totaling $335M when combining long positions.
Yesterday's capture closed the gap of many open stops, in a long squeeze movement. Now the largest open liquidity ranges are above $87,500 and at $75,000.
These regions should be the main supports and resistances, as new liquidity zones are expected to emerge amid these capture movements.
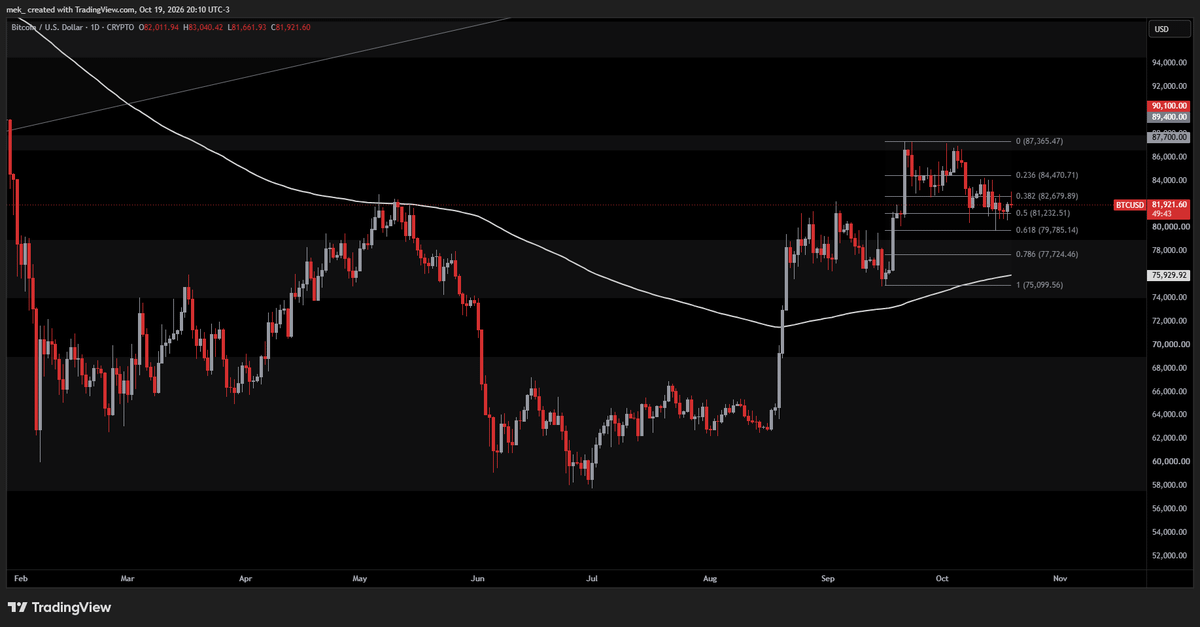
On the daily chart, I measured the retracement from the $87,365 swing high to the $75,100 swing low. The 0.618 level sits at $79,785. That is where the sweep happened.
The Baseline Read
Prompt A. No thesis, no hints.
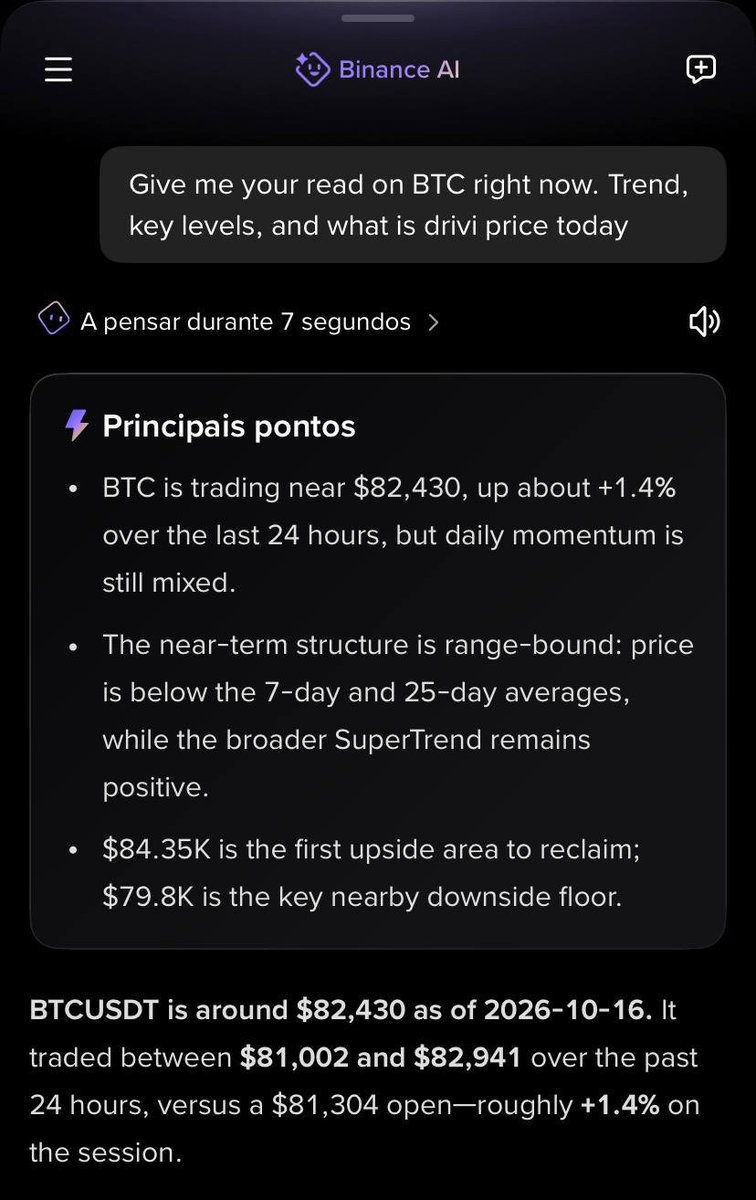
Binance AI put BTC near $82,430 and called the short term picture neutral to soft. Price was just below the 7 day average ($82.59K) and the 25 day average ($83.87K). MACD was bearish after a death cross 17 daily bars earlier. RSI(6) read 45.5. SuperTrend stayed positive near $79.66K. Volume was about 0.63x its 7 day average, and large order flow showed a net outflow.
Its conclusion: a modest rebound inside a range, not a breakout.
My read was about liquidity mechanics. Its read was about indicators and participation. Different lenses. Same range. Same support area near $80K.
Then I compared the maps:
Its 7 day low near $79.8K sits on my 0.618 retracement at $79,785.
Its 30 day range of $75.1K to $87.4K sits on my swing low and high, $75,100 and $87,365.
Its $82.6K zone sits near my 0.382 at $82,680.
Its $84.35K zone sits near my 0.236 at $84,471.
It used moving averages and SuperTrend. I used swing structure. Both arrived at the same map.
The Thesis Audit
Prompt B. This is where I wanted the pushback.
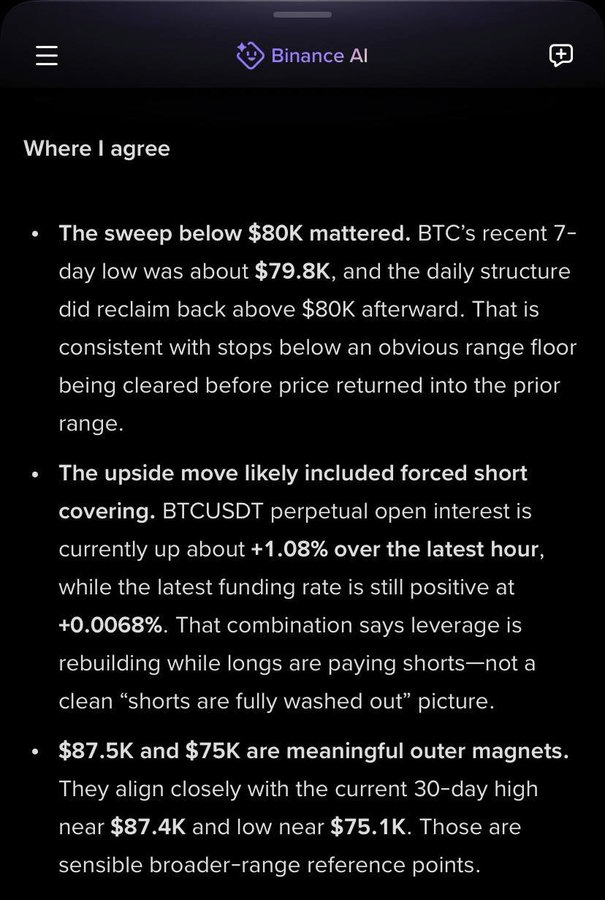
Where it agreed. The sweep below $80K mattered. The 7 day low was about $79.8K and price reclaimed $80K afterward. It also agreed that $87.5K and $75K are meaningful outer magnets, because they align with the 30 day high and low.
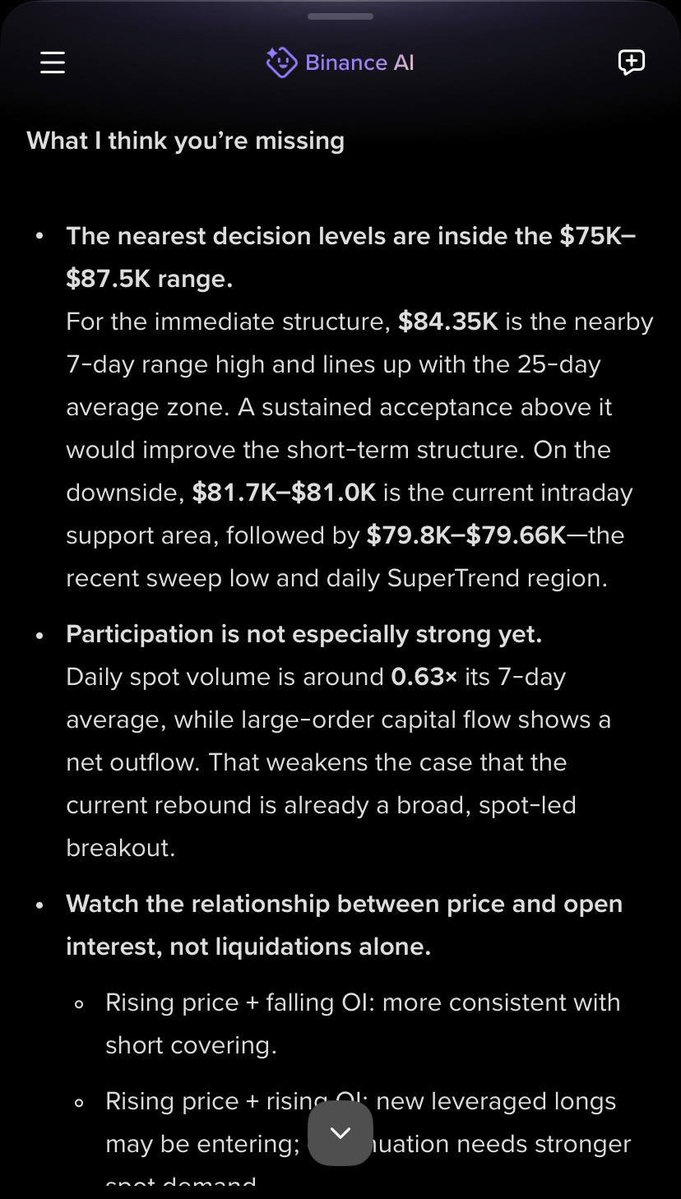
Where it qualified. Three points:
Liquidation zones are not automatic support or resistance. They attract price. What actually holds or rejects price is acceptance, spot volume and positioning.
The recovery was only partly resolved. Price was still below the 7 and 25 day averages, and the daily MACD was still bearish.
The squeeze may be turning into fresh long exposure. 61.8% of accounts were long, top traders were 59.6% long by position value, funding was positive and open interest was rising.
What it added. A price versus open interest matrix:
Rising price with rising OI points to new leveraged longs.
Rising price with falling OI is more consistent with short covering.
Falling price with rising OI suggests fresh shorts.
Falling price with falling OI suggests deleveraging near exhaustion.
Its synthesis: a broad range from $75K to $87.5K, with a tighter actionable structure from $79.8K to $84.35K.
My reaction. The first point was the sharpest. In my public posts I call these zones magnets. In the prompt, I wrote support and resistance. Those are different claims. A magnet pulls price. A level holds it. The assistant caught the looser wording. That is exactly what I wanted from a second opinion.
What the data says. The assistant never cited liquidation data. It described a two sided deleveraging from price structure and positioning. Coinglass supports that description. Over 24 hours, $151.69M of longs and $183.98M of shorts were liquidated, $335.67M in total across 80,879 traders. In the last hour, $37.12M of the $40.65M liquidated were shorts, about 91%.
One caveat. That panel covers the whole crypto market, not only BTC. The largest single order was ETHUSDT.
Derivatives and Liquidity
Prompts C and F.
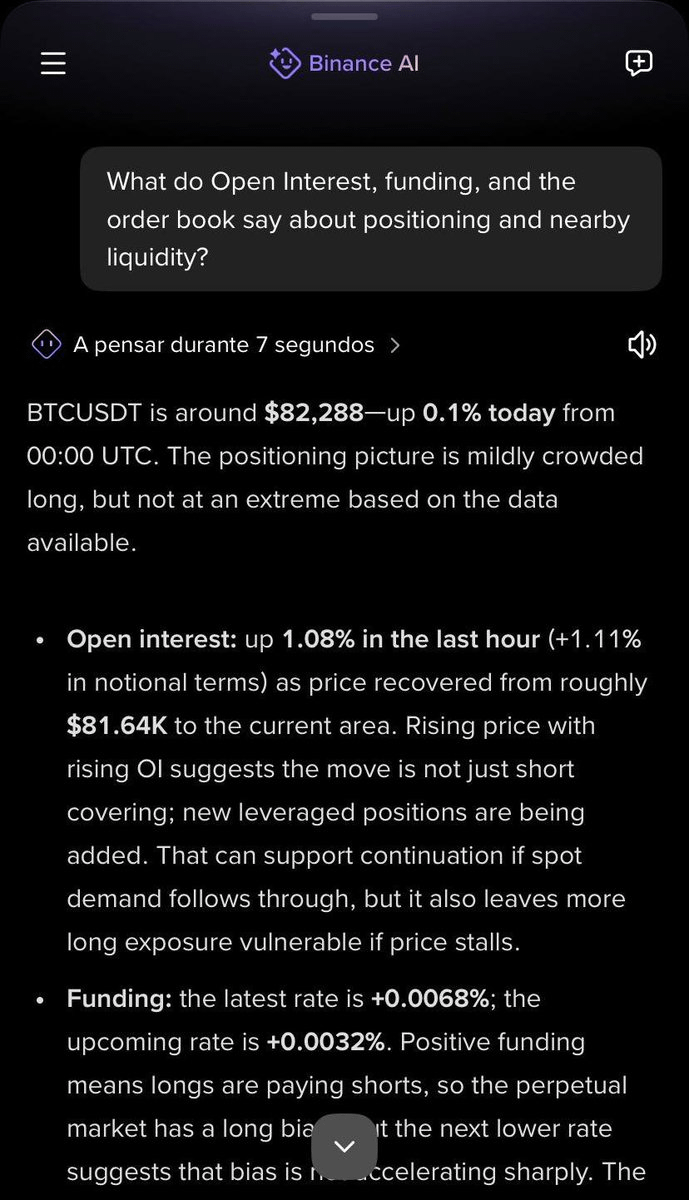
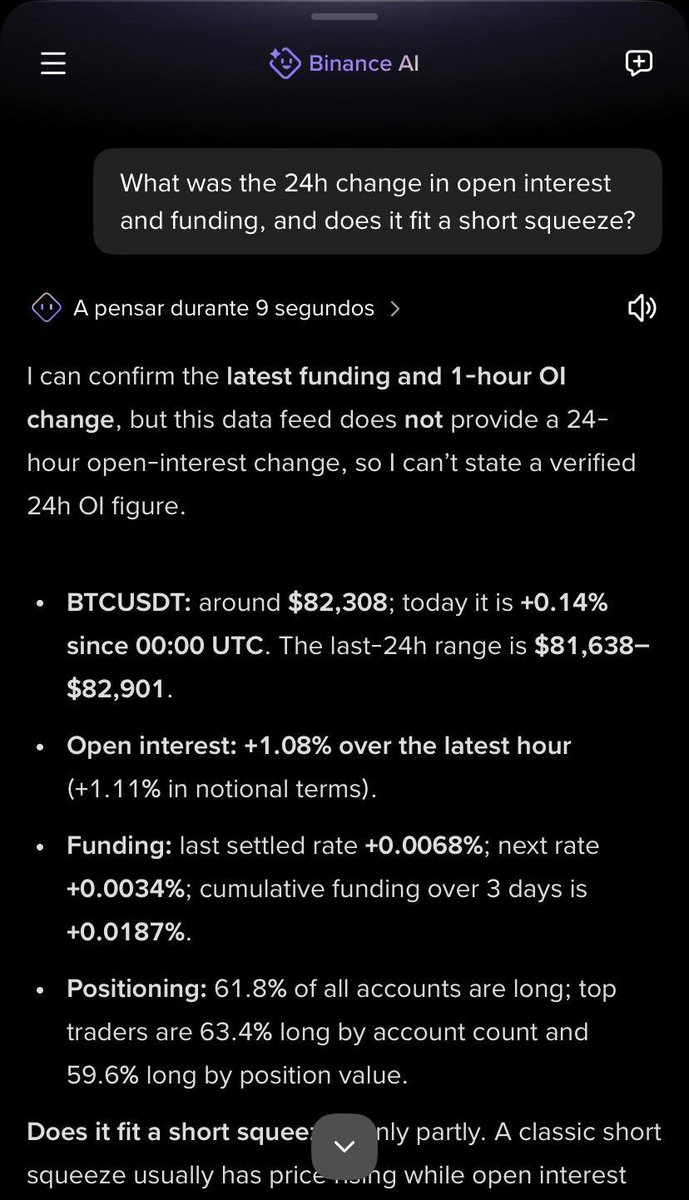
On prompt C, Binance AI reported open interest up 1.08% in the last hour, funding at +0.0068% with the next rate at +0.0032%, and a net long tilt in account ratios. Its read: mildly crowded long, not extreme.
Then came the line that matters most for anyone who trades liquidity:
I don't have a live depth snapshot in this feed, so I can't claim exact resting bid and ask walls.
I respect that. It did not invent an order book. But it also means the liquidity map it gave me came from price structure, not from the book and not from a heatmap.
My heatmap shows the difference. Dense bands near $87.5K to $88K and $74K to $75K. And a dense band near $80K to $80.5K that built from late September until price wicked into it on October 15.
On prompt F, I asked directly for the 24 hour change in open interest. The assistant said its data feed does not provide it, so it could not state a verified figure. Its read: a rebound that may have started with short covering, now joined by fresh leveraged participation.
That fits the liquidation data. The last hour was driven by shorts. But without the 24 hour OI change, the full squeeze sequence cannot be confirmed from inside the tool.
I would rather have an honest "I don't have this" than a confident guess.
Macro and Institutional Flows
Prompt D.
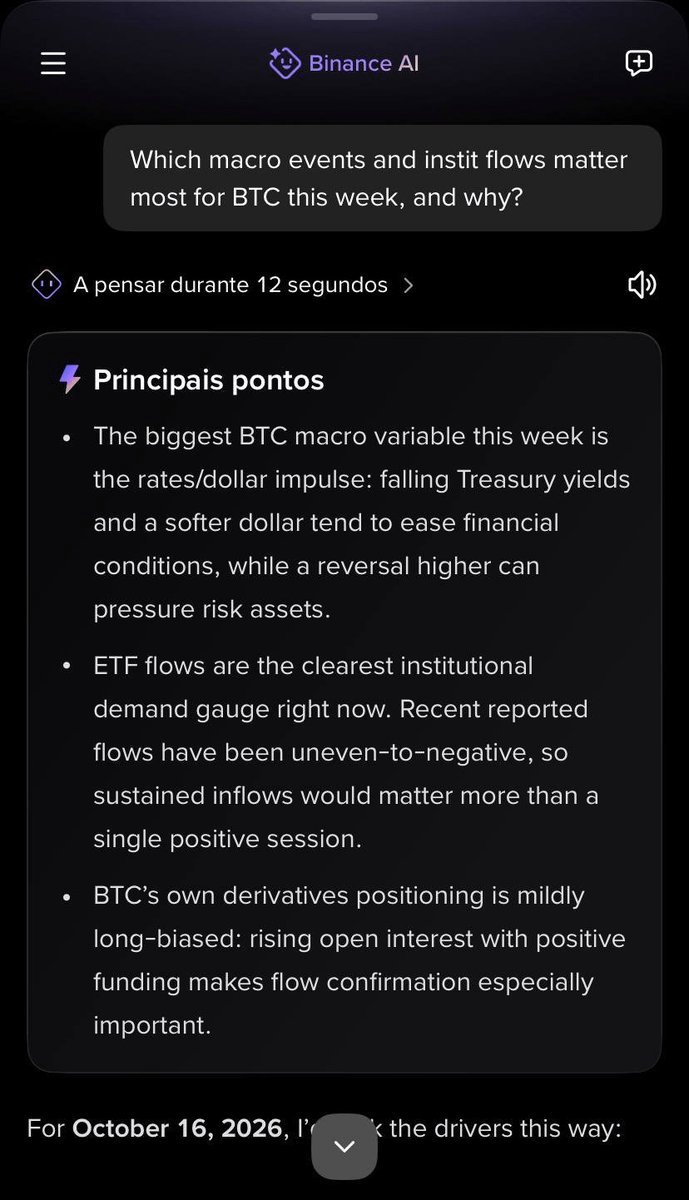
Binance AI ranked four drivers: US rates and the dollar, spot Bitcoin ETF flows, futures positioning, and the cross asset risk tone across equities, credit, gold and oil. It listed the next FOMC decision for October 27 to 28 and gave three scenarios for what would change its read.
It also cited ETF flows from public trackers: a $261.4M net outflow on October 14 and a $5.06M net inflow on October 15.
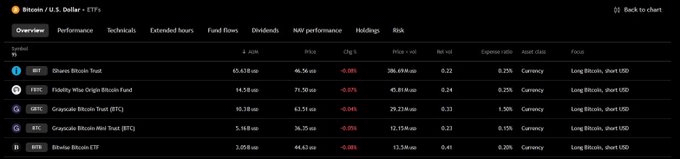
TradingView's ETF overview shows IBIT at $65.63B in AUM, FBTC at $14.5B, GBTC at $10.3B, the Grayscale mini fund at $5.16B and BITB at $3.05B. All five were slightly negative on the session, and relative volume sat between 0.22 and 0.41 when I captured it.
That does not confirm the daily flow figures. This tab shows AUM and relative volume, not net flows. Treat the two flow numbers as the assistant's reported figures from public trackers, which the assistant itself said were not verified against issuer data.
My assessment. Good framework. Thin data. And one miss.
The assistant asked whether the recent easing in Treasury yields and the dollar would persist. It did not give a dated quote for either. It also did not mention CPI or PPI. Both surprised to the upside this week. CPI printed 3.7% year on year against 3.6% expected (BLS, October 14). PPI printed 6.3% year on year against 5.3% expected (BLS, October 15). I covered both on Binance Square.
For a question about this week's macro drivers, those two prints are the main event.
The Source Audit
Prompt E.
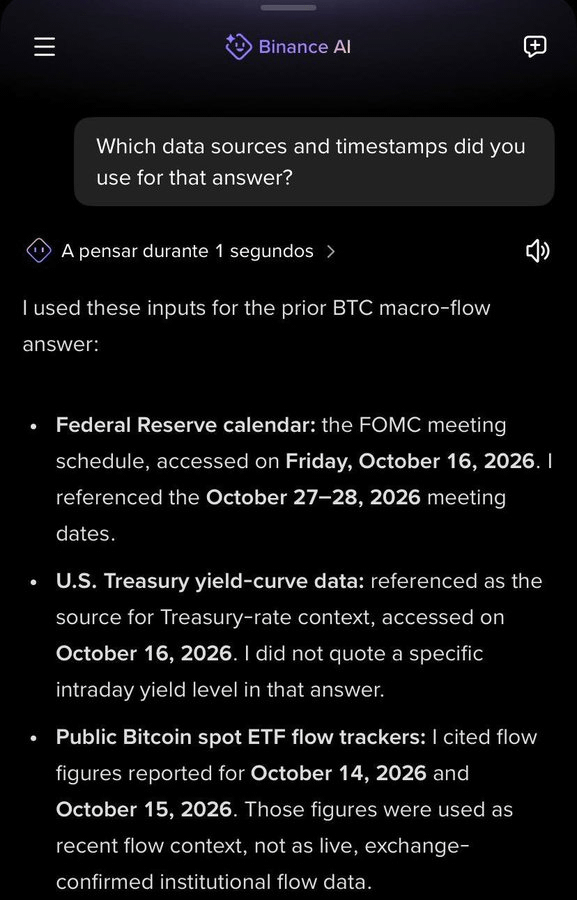
I asked what data sources and timestamps it used. The assistant listed:
The Federal Reserve calendar, accessed October 16.
US Treasury yield curve data as context, with no intraday yield quoted.
Public Bitcoin ETF flow trackers, for the October 14 and 15 figures.
Binance BTCUSDT derivatives data, queried during the response.
Then it listed what it did not have: no timestamped quote for the dollar index, equities, credit spreads, gold or oil, and no verification of the ETF figures against issuer publications.
This is the habit I want from any research tool. It names what it used, what it did not use, and where the data is secondhand.
One note. It did not volunteer this. I had to ask.
Verification Table
BTC support, 7 day low near $79.8K
Check: TradingView daily, 0.618 retracement at $79,785.
Result: Matched.
30 day range, $75.1K to $87.4K
Check: TradingView swing points $75,099.56 and $87,365.47. Binance perp heatmap high $87,385.1 and low $74,909.4.
Result: Matched, within about $200 across venues.
Overhead zones, $82.6K and $84.35K
Check: 0.382 at $82,680 and 0.236 at $84,471.
Result: Close, within about $120.
Two sided deleveraging
Check: Coinglass 24h, $151.69M longs and $183.98M shorts.
Result: Consistent. The assistant inferred it and did not cite liquidation data.
Outer liquidity at $87.5K and $75K
Check: Heatmap bands near $87.5K to $88K and $74K to $75K.
Result: Matched. The assistant reached these through range extremes, not through a heatmap.
Funding, 1 hour OI change, long share of accounts
Check: Not independently captured in this test.
Result: Unverified. Reported by the assistant from Binance derivatives data.
24 hour open interest change
Result: Not provided by the assistant.
ETF net flows, October 14 and 15
Check: TradingView overview shows AUM and relative volume, not flows.
Result: Unverified. The assistant flagged them as tracker figures.
Recent easing in yields and the dollar
Check: No dated quote provided. CPI and PPI both surprised higher this week.
Result: Unverified. Treat with caution.
Scorecard
My assessment, on this test only.
Relevance: 4 out of 5. It stayed on BTC and on my question.
Accuracy on what I could check: 4 out of 5. Levels and liquidation framing matched.
Depth: 3 out of 5. No order book depth, no 24 hour OI, thin macro numbers.
Time saved: 4 out of 5. A structured second opinion across structure, derivatives and macro without opening five tabs.
Transparency: 4 out of 5. Sources and gaps disclosed. Not volunteered.

What Worked, What Did Not
What worked
It disagreed with me, specifically and usefully.
Its levels converged with an independent method.
It admitted gaps instead of filling them.
Every answer carried a clear disclaimer.
What did not
No chart or image input at the time of testing.
No live order book depth or liquidation heatmap.
No 24 hour open interest change.
The macro answer had no dated quotes and skipped the week's CPI and PPI.
The baselines for daily change differed. Prompt A reported about +1.4% against a $81,304 open. Later answers reported +0.1% to +0.18% since 00:00 UTC. One label would remove the confusion.
Product Feedback
Image upload for charts and heatmaps. The comparison I wanted needs it.
Order book depth and liquidation data inside the derivatives answer.
The 24 hour OI change next to the hourly figure.
A fixed timestamp and baseline on every number.
Inline sources on the first answer, not only when asked.
Dated macro quotes and the week's economic calendar, including CPI and PPI.
Web and desktop availability. Serious analysis happens on a large screen.
Where Binance AI Fits in a Trader's Workflow
Think of it as a second analyst who reads fast, speaks plainly and admits what he has not seen.
It is not a terminal. It does not replace TradingView, Coinglass or your own judgment.
Before a session, it is a cheap way to find the hole in your thesis. As a source of truth, it is a risk.
Price goes where the orders are, not where the narrative is. Today Binance AI shows you structure and positioning. The order book and the heatmap are the missing pieces.
Try It Yourself
Open the Binance app on mobile and find Binance AI.
Write your own read first. Save it with a timestamp.
Ask for an independent read of the same asset.
Paste your thesis. Ask where it agrees, where it disagrees and what you are missing.
Ask about derivatives and the macro drivers.
Ask for sources and timestamps.
Check three numbers on your own tools.
Use the six prompts from the Methodology section.
Try it yourself. Write your read first. Then ask Binance AI to challenge it. Tell me what it caught that you missed.
Official Binance AI guide:
https://www.binance.com/en/blog/ecosystem/5585027824672566322
Availability depends on your region. Binance AI provides information and context. It does not replace your own research or judgment. Nothing in this article is investment advice or a trade recommendation.
@Binance