

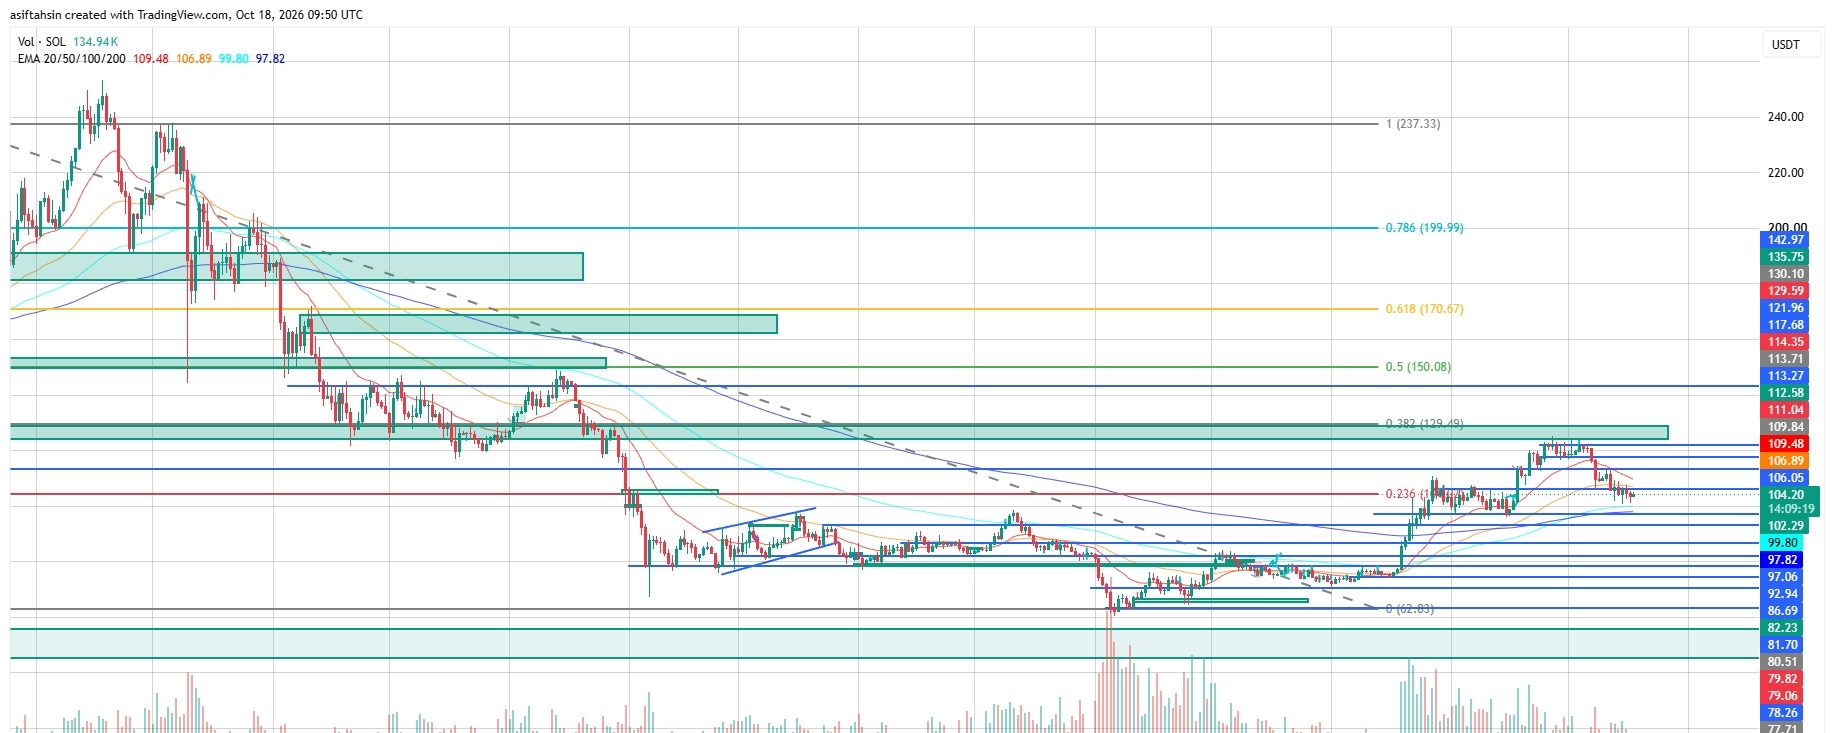

Solana (SOL) is trading around $104.20 after facing rejection from the $108–$110 resistance zone. The latest pullback has pushed price below the 20 EMA and 50 EMA, while RSI has dropped to 39.05, indicating weakening momentum.
SOL is now testing an important support region around $102–$104. Buyers need to defend this area and reclaim nearby resistance to prevent a deeper correction.
📈 EMA Structure
🔹 20 EMA: $109.48
🔹 50 EMA: $106.89
🔹 100 EMA: $99.80
🔹 200 EMA: $97.82
SOL is trading below the 20 EMA and 50 EMA, indicating short-term bearish pressure. The 100 EMA and 200 EMA remain important support references.
A sustained recovery above $106.89–$109.48 would improve the short-term structure. Until then, sellers may continue to pressure price during recovery attempts.
📐 Fibonacci Levels
🔹 0: $62.83
🔹 0.236: $104.04
🔹 0.382: $129.49
🔹 0.5: $150.08
🔹 0.618: $170.67
🔹 0.786: $199.99
🔹 1.0: $237.33
SOL is trading close to the 0.236 Fibonacci level near $104.04. Holding this area could help buyers stabilize price, while a confirmed breakdown may expose lower support zones.
The immediate focus is whether SOL can defend the $102–$104 region and regain bullish momentum.
🟢 Bullish Scenario
Immediate resistance is around $106.05, followed by $106.89.
Potential upside targets:
🎯 $109.48–$109.84
🎯 $111.04–$112.58
🎯 $113.27–$114.35
🎯 $117.68–$121.96
🎯 $129.49
Reclaiming $106.89 would be an early sign of recovery. A stronger bullish move requires SOL to break above $109.48–$111.04 and hold that region as support.
If buying pressure increases, price could extend toward $113–$114.35 and potentially the $117.68–$121.96 resistance zone.
🔴 Pullback Scenario
Key support levels:
⚠️ $104.20–$102.29
⚠️ $99.81–$99.80
⚠️ $97.82–$97.06
⚠️ $92.94
⚠️ $86.69–$82.23
⚠️ $81.70–$79.06
If SOL loses $102.29, price could retest the $99.80 EMA 100 area. A sustained breakdown below $97.82–$97.06 would weaken the broader recovery structure and expose $92.94.
If selling pressure continues, the $86.69–$82.23 support region could become relevant.
🧠 Market Structure & Liquidity
Recovery → Resistance Rejection → Pullback → Support Test → Potential Bounce or Breakdown
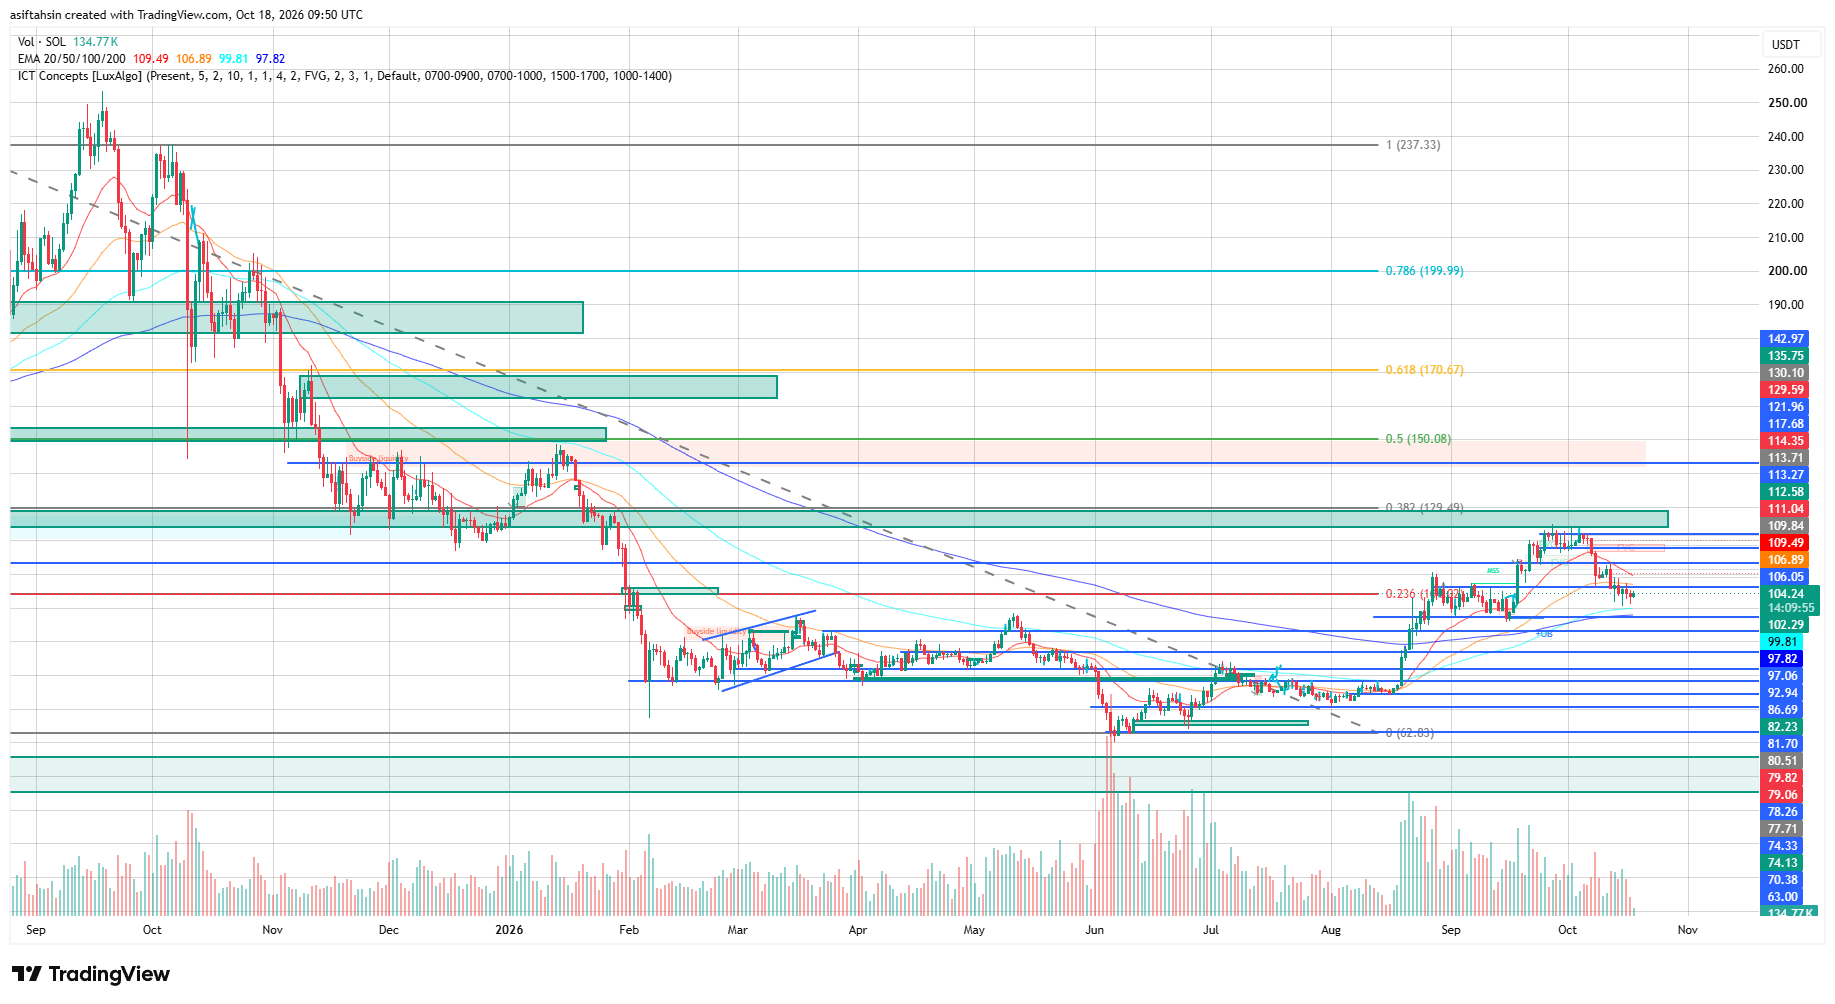
SOL recovered strongly from its June low near $62.83, but the recent rejection around $108–$110 has brought sellers back into control in the short term.
The $102–$104 region is the immediate decision zone. Holding support could trigger a bounce toward $106.89 and $109.48. Losing support could bring the $99.80–$97.82 area into focus.
📊 RSI Momentum
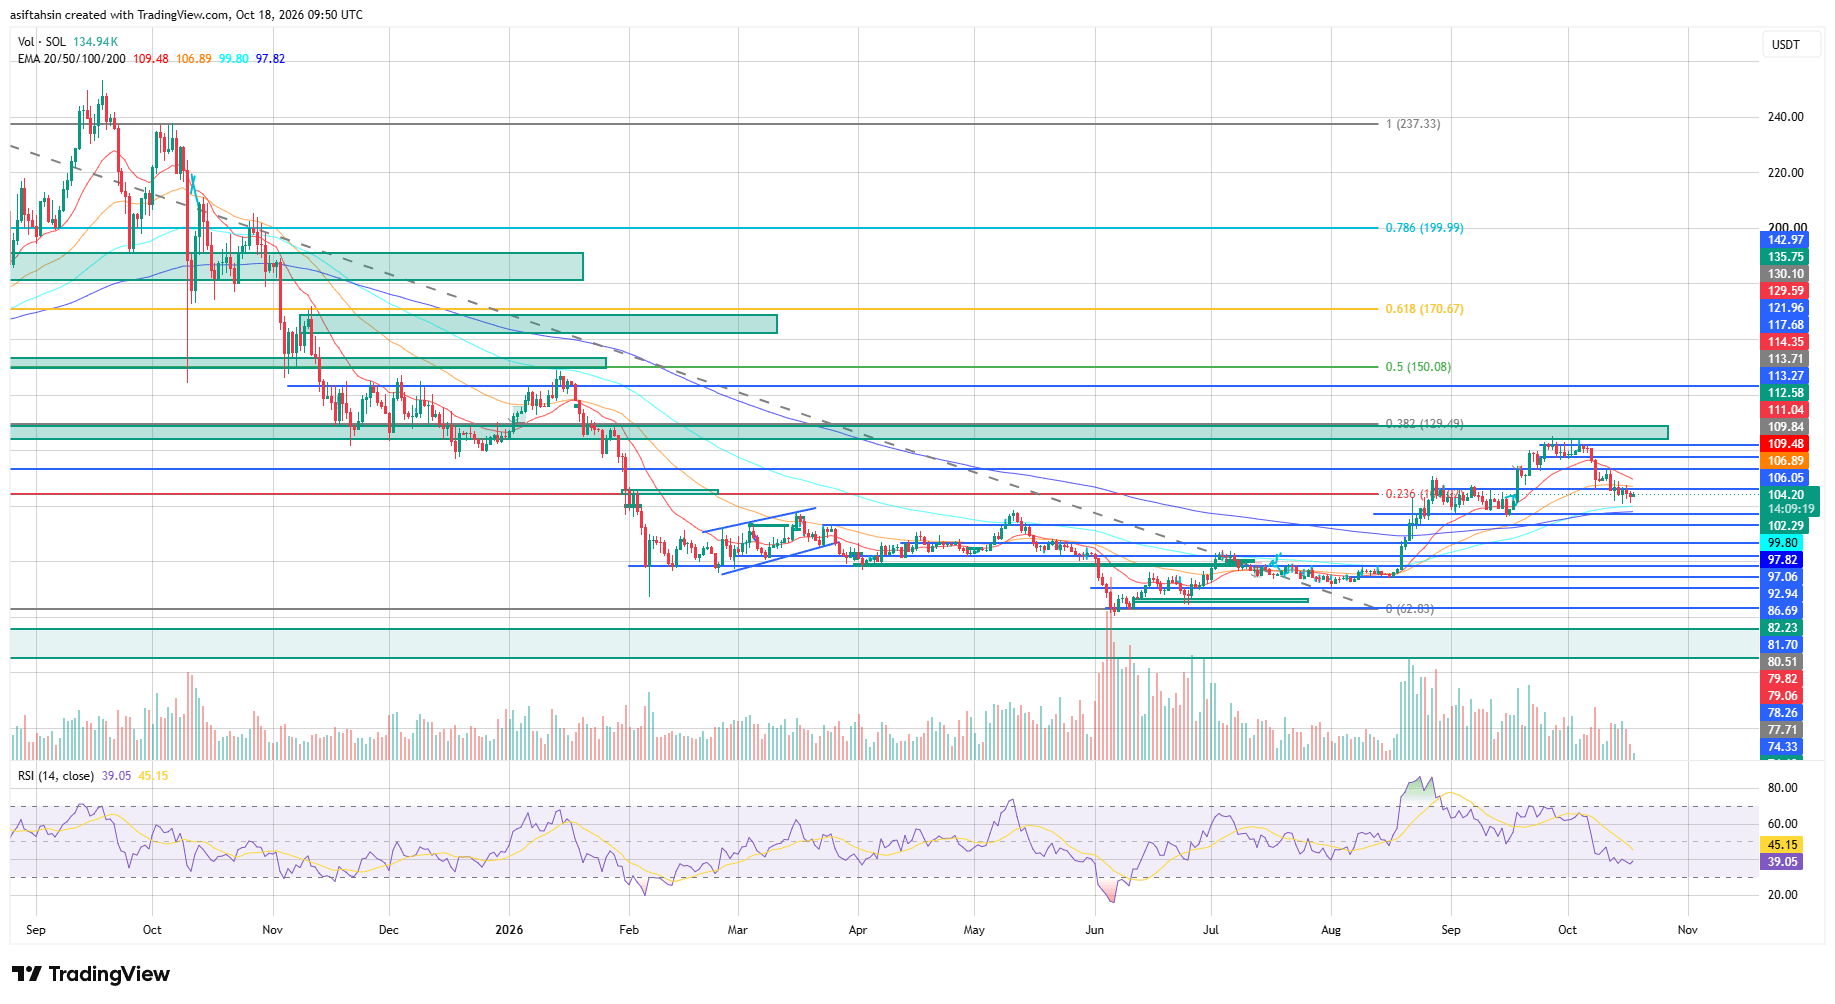
🔹 RSI: 39.05
🔹 RSI MA: 45.15
RSI is below 50 and under its moving average, confirming weak momentum. Although the indicator is approaching oversold territory, this does not guarantee an immediate reversal.
A recovery above 45, supported by a price reclaim of $106.89, would indicate improving momentum. Continued weakness alongside a breakdown below $102 could increase downside pressure.
🎯 Key Levels
Resistance: $106.05 → $106.89 → $109.48 → $111.04 → $112.58 → $114.35 → $117.68 → $121.96 → $129.49
Support: $104.04 → $102.29 → $99.80 → $97.82 → $97.06 → $92.94 → $86.69 → $82.23 → $79.06
📌 Final Outlook
SOL's short-term structure has weakened below the 20 EMA and 50 EMA, with RSI at 39.05 reflecting persistent selling pressure.
The immediate battle is around $102–$104. Holding this zone could support a recovery toward $106.89, $109.48 and $111.04. Reclaiming $109.48 would provide stronger evidence of a bullish recovery.
On the downside, losing $102.29 could expose $99.80 and $97.82, with $92.94 as the next important support reference.
Bias: Short-term bearish below $106.89–$109.48. Holding $99.80–$102.29 could allow a relief bounce, while a confirmed breakdown below $97.82 would increase downside risk.
